
Figure 1.
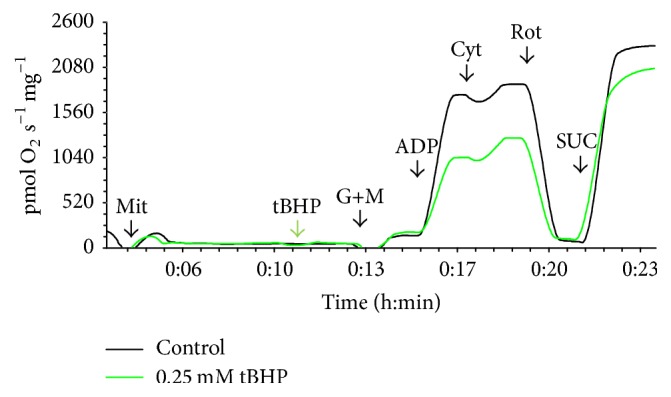
Representative curves of the oxygen consumption ratio in control isolated mitochondria (black curve) and mitochondria exposed to 0.25 mM tBHP (green curve). Additions are marked at the X-axis: Mit = mitochondria (0.15 mg protein per mL), tBHP = 0.25 mM tBHP, G+M = 10 mM glutamate and 2.5 mM malate, ADP = 1.5 mM adenosine diphosphate, Cyt = 20 μM cytochrome c, ROT = 1 μM rotenone, and SUC = 10 mM succinate.