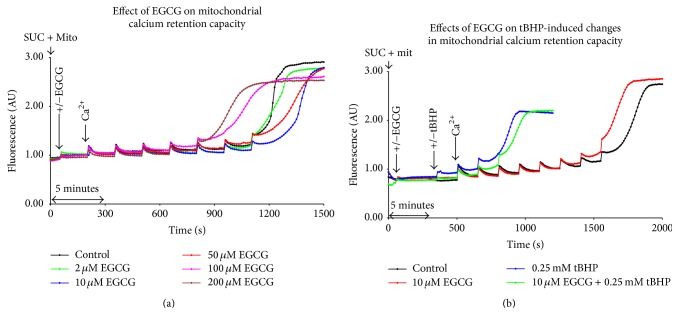
Figure 4.
Representative curves of mitochondrial calcium retention capacity using Calcium Green after treatment with EGCG and/or tBHP. CaCl2 was added to increase its final concentration by 1.25 μM upon every addition. (a) The effect of EGCG alone; (b) pretreatment with 10 μM EGCG before the addition of 0.25 mM tBHP. AU = Arbitrary Units, SUC = 10 mM succinate, and Mit = mitochondria (0.4 mg protein per mL).

