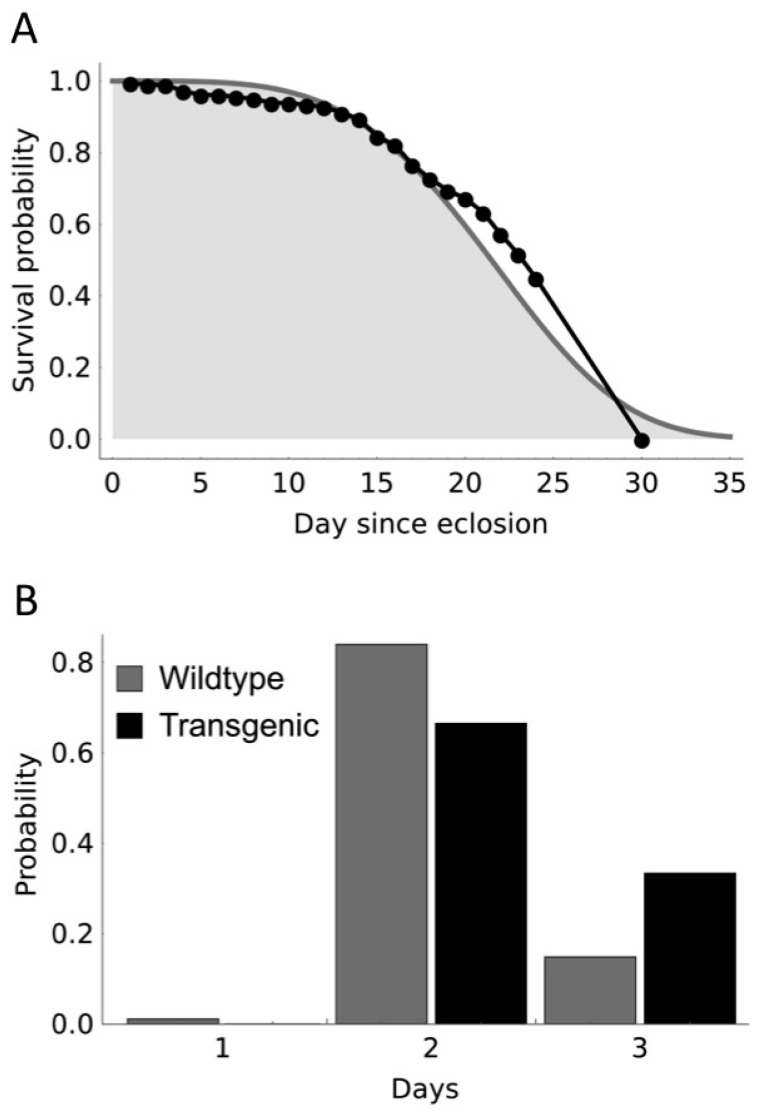
Figure 1.
Adult longevity and duration of pupation used for the model. (A) illustrates adult longevity data (black markers) of [23] that was used to fit a Weibull curve for survival (solid line delimiting gray area fitted by maximizing likelihood). In addition to the data which was available for 24 days, we assumed all adults died before day 30; and (B) the distribution of pupal development times used for model parameterization is shown, based on summarized data [22].

