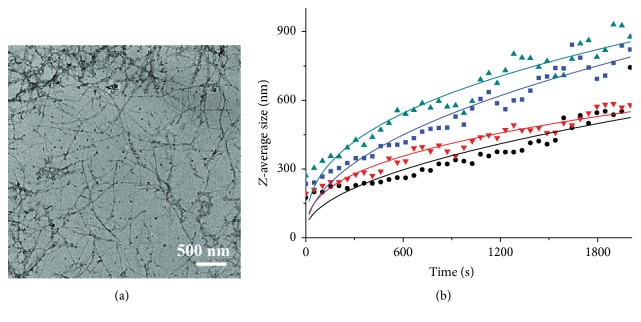
Figure 10.
The influence of Al(III)/EGCG complex on the fibrillation and nucleation of hIAPP. (a) TEM image of 16 μM hIAPP incubated with 2 μM Al(III) and 2 μM EGCG for 2 h. (b) Dependence of Z-average size on the nucleation time of 16 μM hIAPP incubated without (■), and with 2 μM EGCG (●), 2 μM Al(III) (▲), and 2 μM Al/EGCG in molar ration of 1 : 1 (▼) by DLS assay. Solid lines represent the curves fitted using (2).

