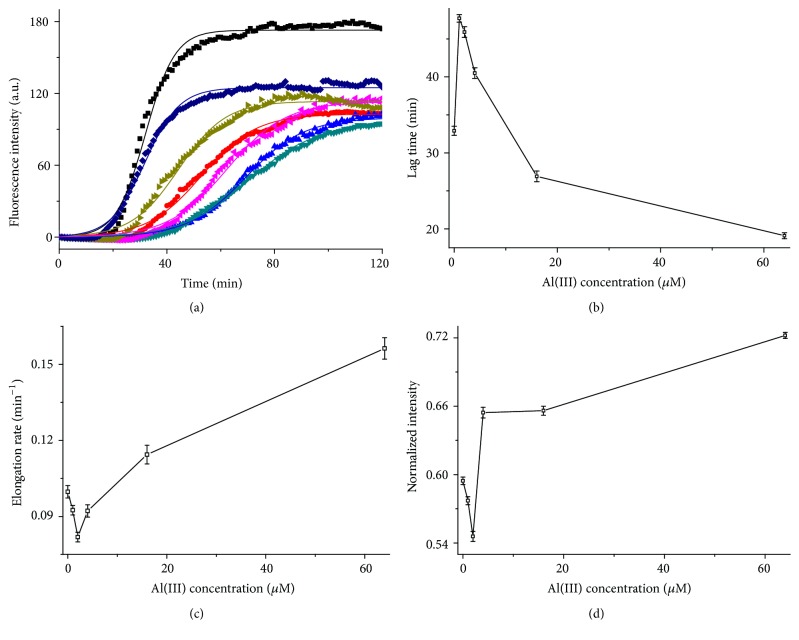
Figure 9.
The influence of Al(III) on the EGCG-interfered hIAPP fibrillation. (a) Kinetics of 16 μM hIAPP fibrillation without (■) or with 2 μM EGCG interfered by addition of 0 (●), 1 (▲), 2 (▼), 4 (◂), 16 (▸), and 64 (◆) μM Al(III) monitored by ThT fluorescence. The values represent mean (n = 3). Solid lines represent the curves fitted using (1). (b) Lag time, (c) elongation rate, and (d) the normalized maximum ThT fluorescence of hIAPP aggregation with 2 μM EGCG on the Al(III) concentration. The intensity values were normalized to hIAPP alone data.

