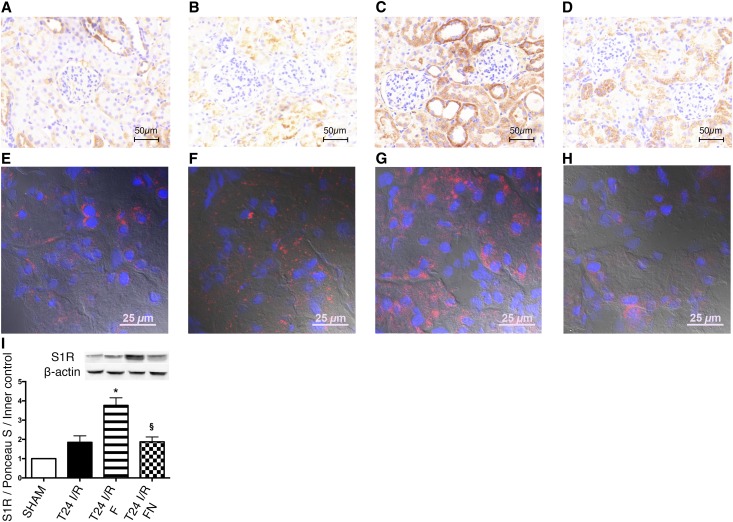
Figure 6.
S1R translocates after renal I/R and FLU treatment. (A–D) Representative anti–S1R DAB–stained kidney sections of (A) sham-operated, (B) T24 I/R, (C) T24 I/R F, and (D) T24 I/R FN rats. Scale bar, 50 μm. (E–H) Representative immunohistochemical double–stained kidney sections for nuclei (blue) and S1R (red) of (E) sham-operated, (F) T24 I/R, (G) T24 I/R F, and (H) T24 I/R FN rats. Scale bar, 25 μm. (I) Immunoblot for renal S1R expression. Representative blots are shown. Bars indicate means±SEMs, and data were analyzed by one-way ANOVA with Bonferroni multiple comparison test. *P<0.05 versus T24 I/R (n=5–7 per group); §P<0.05 versus T24 I/R F (n=5–7 per group).

