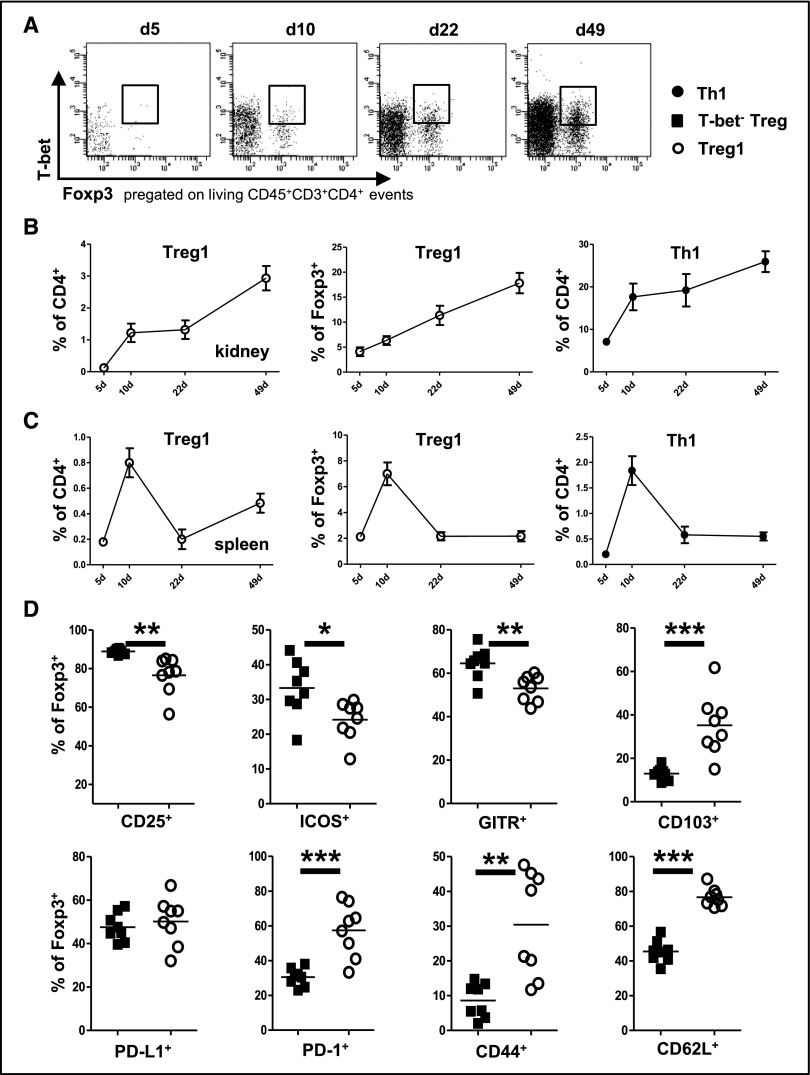
Figure 1.
T-bet+ Treg cells expand during cGN. (A) Representative FACS plots showing renal T-bet+Foxp3+ Treg1 cells at the indicated time points after induction of NTN. (B and C) Quantification of (B) renal and (C) splenic T-bet+Foxp3+ Treg1 and T-bet+Foxp3− Th1 cells as percentages of CD4+ or Foxp3+ cells at the indicated time points after induction of NTN; n≥5 C57BL/6 mice were analyzed at each time point. (D) FACS analysis of surface molecule expression on the indicated splenic Treg cell populations at day 8 after induction of NTN; n=8 C57BL/6 mice were analyzed. Circles in D represent individual animals, and horizontal lines represent mean values. Error bars represent SEM. *P<0.05; **P<0.01; ***P<0.001.

