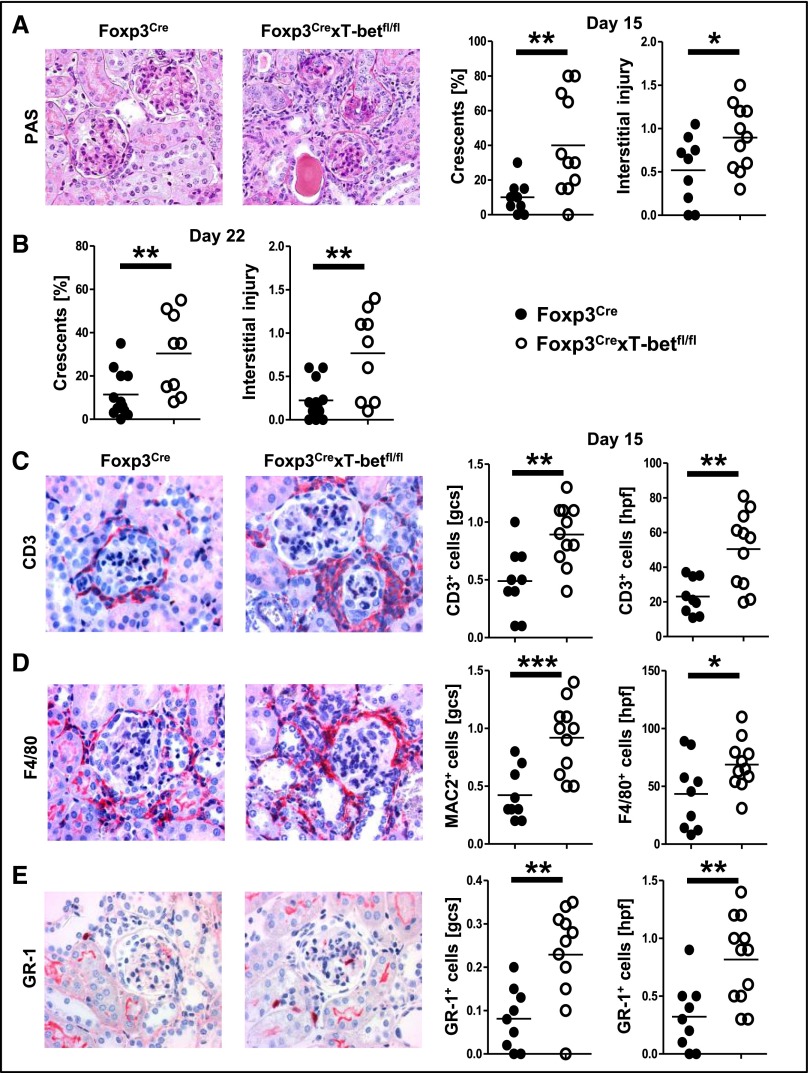
Figure 4.
NTN is aggravated in the absence of Treg1 cells. (A) Representative photographs of periodic acid–Schiff (PAS) –stained kidney sections and quantification of crescents and interstitial injury at day 15 after NTN. Original magnification, ×200. (B) Quantification of crescents and interstitial injury at day 22 after NTN. (C) Representative photographs and quantification of glomerular and interstitial CD3+ T cells. Original magnification, ×400. (D) Representative photographs of F4/80–stained renal macrophages and quantification of glomerular (MAC-2+) and interstitial (F4/80+) macrophages. Original magnification, ×400. (E) Representative photographs of GR-1–stained kidneys and quantification of glomerular and interstitial GR-1+ neutrophils. Original magnification, ×400. One of two representative sets for A is shown. Nine Foxp3Cre versus 11 Foxp3CrexT-betfl/fl mice were analyzed at day 15, and 12 Foxp3Cre versus nine Foxp3CrexT-betfl/fl mice were analyzed at day 22. Circles represent individual animals, and horizontal lines represent mean values. *P<0.05; **P<0.01; ***P<0.001.

