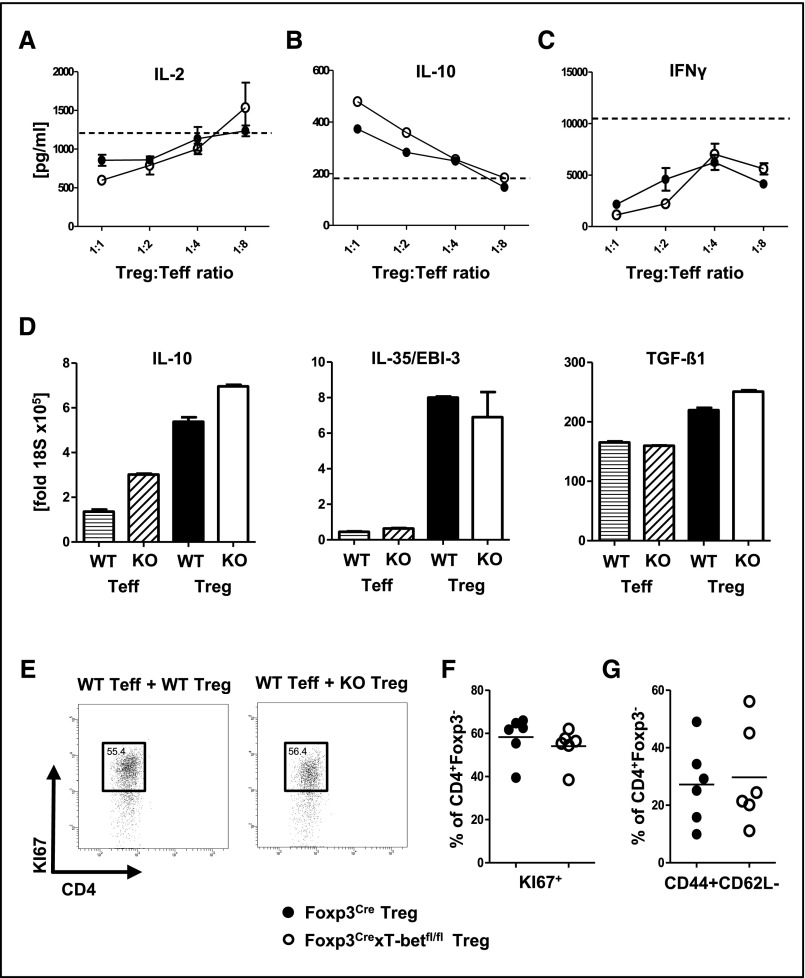
Figure 5.
Intact Treg cell–suppressive function in the absence of T-bet activation. (A–C) In vitro suppression assays were performed by coculturing wild–type CD4+ Teffs with Treg cells from Foxp3CrexT-betfl/fl mice or Foxp3Cre controls at the indicated ratios (n=3 per group). Cytokine levels of (A) IL-2, (B) IL-10, and (C) IFNγ were analyzed in coculture supernatants as indicated. Dotted lines represent Teffs alone without Treg cells (n=3). (D) Quantification of IL-10, IL35/EBI-3, and TGF-β1 mRNA by quantitative RT-PCR from the indicated spleen cell populations FACS sorted at day 12 after immunization with sheep IgG. (E) Representative FACS plots and (F) quantification of KI67+ proliferating CD4+Foxp3− Teffs from spleens of immunized Rag1−/− recipients harboring Treg cells from the indicated mouse strains. (G) FACS analysis of splenic CD4+ Teff activation from immunized Rag1−/− recipients harboring Treg cells of the indicated genotype; n=6 versus six mice were analyzed in E–G. Circles represent individual animals, and horizontal lines represent mean values. Error bars represent SEM. KO, Foxp3CrexT-betfl/fl mice; WT, Foxp3Cre controls.

