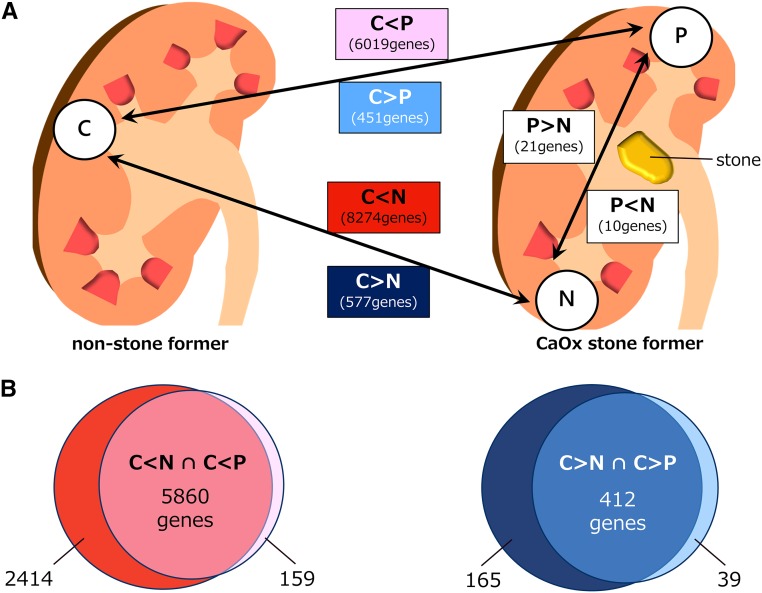
Figure 4.
Scheme of the microarray analysis demonstrated diversity of gene expression difference among each group. (A) Comparison of each group and gene expression changes. Each extracted value represents the number of statistically different genes with >2.0- or <0.5-fold difference in expression between groups. P, RP papillary tissue group from CaOx SFs; N, normal papillary tissue group from CaOx SFs; C, normal papillary tissue group from control patients. (B) Venn diagram of a select number of genes that showed >2.0-fold difference in expression in both normal and RP papillary tissue of CaOx SFs compared with normal papillary tissue of control patients (left red figure), and the number of genes that showed <0.5-fold difference in expression in both normal and RP papillary tissue of CaOx SFs compared with normal papillary tissue of control patients (right blue figure).

