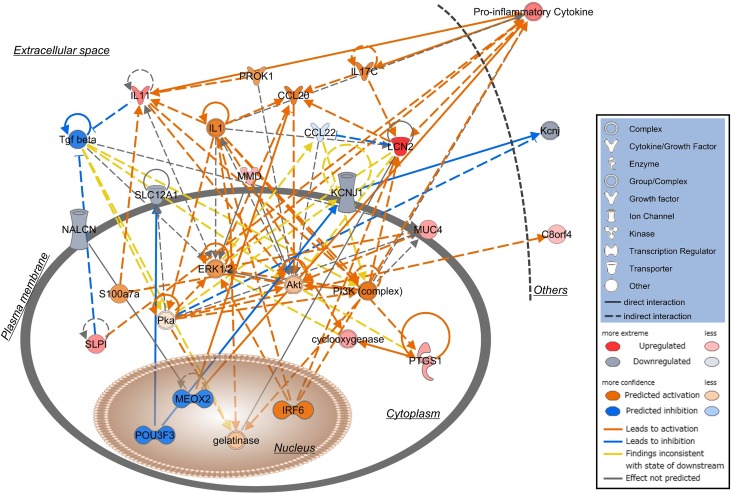
Figure 5.
Network function of inflammatory response, cellular movement, cell-to-cell signaling, and interaction between RP and normal papillary tissues in CaOx SFs (defined by either >2.0- or <0.5-fold difference in expression; P<0.01). Red shapes indicate upregulated mRNAs, while gray shapes indicate downregulated mRNAs. Different shapes and prediction outlines are indicated in the legend box.

