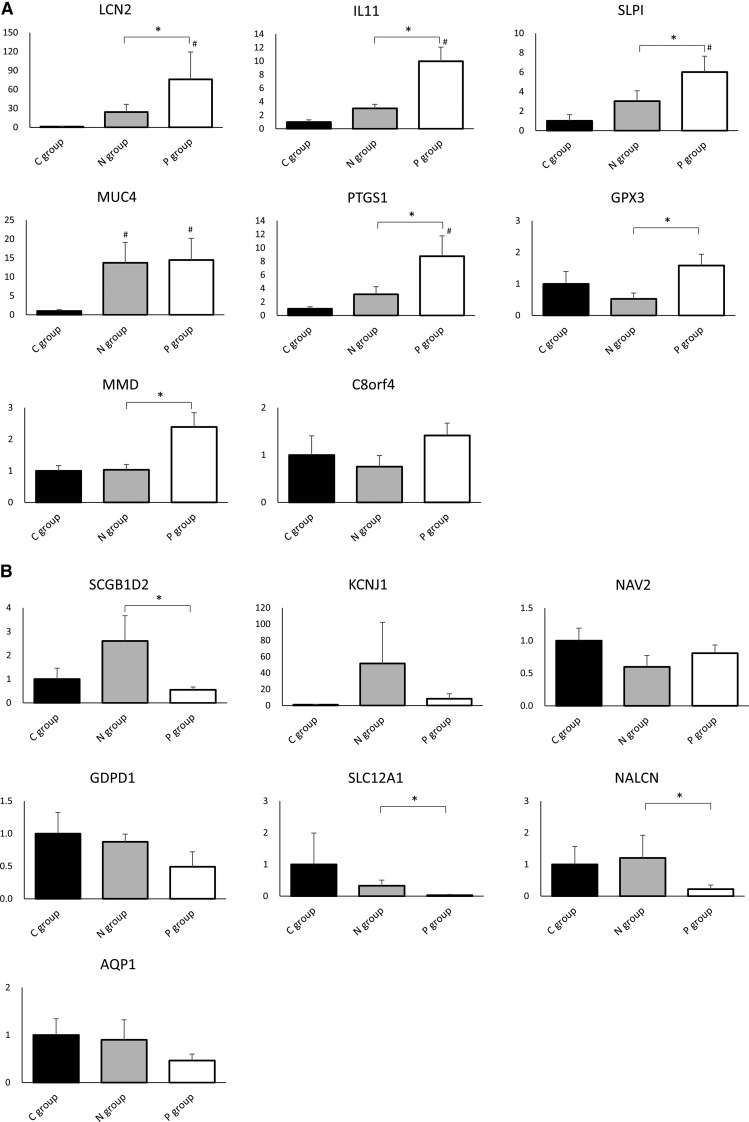
Figure 6.
mRNA validation by qPCR shows significant higher expression of LCN2, IL11, SLPI, PTGS1, GPX3, and MMD; whereas lower expression of SCGB1D2, SLC12A1, and NALCN is shown in P group compared with N group. mRNA validation of genes showing either (A) >2.0- or (B) <0.5-fold difference in expression in RP papillary tissue compared with that in normal papillary tissue of CaOx SFs. The expression of each gene investigated was determined using qPCR performed using TaqMan assays. The data are presented as means±SEMs. Control values are the average of the data for the C group. *P<0.05 for comparisons between the N and P groups; #P<0.05 compared with the C groups. C8orf4, chromosome 8 open reading frame 4; GDPD1, glycerophosphodiester phosphodiesterase domain containing 1; KCNJ1, potassium channel inwardly rectifying subfamily J member 1; MUC4, mucin 4; NAV2, neuron navigator 2.

