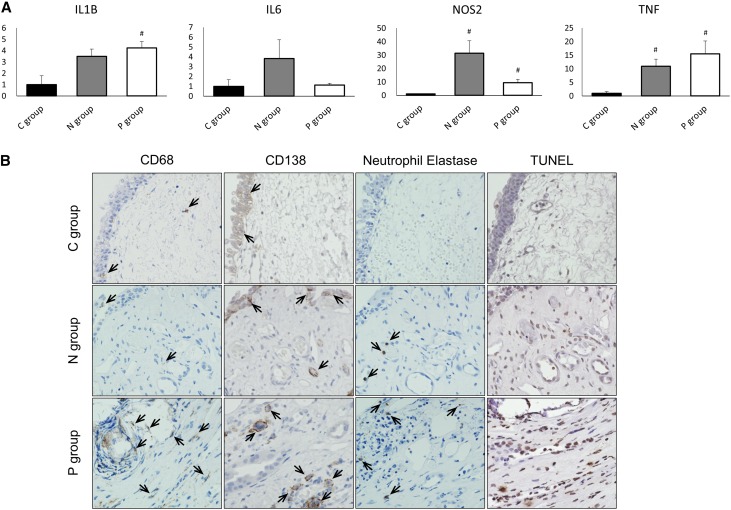
Figure 8.
Validation of proinflammatory and apoptotic assay in RP and normal papillary tissues from CaOx SFs and normal papillary tissues from control patients. (A) mRNA expression. The data are presented as the means±SEMs. Control values are the average values of the data for the C group. #P<0.05 compared with the C groups. NOS2, nitric oxide synthase 2. (B) Immunohistochemical staining. Cells stained positive for CD68, CD138, and neutrophil elastase (each arrow) are shown in each representative microphotograph. Magnification, ×400.

