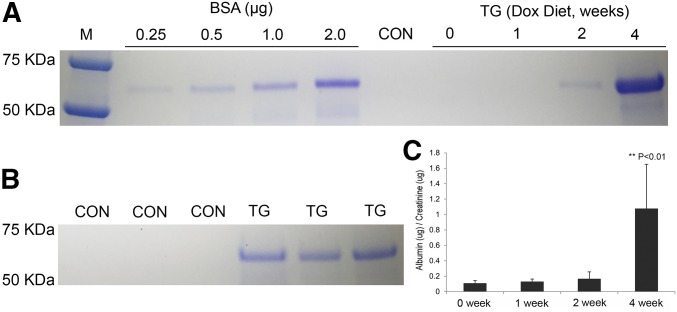
Figure 3.
Urinary albumin levels in claudin-1–induced animals. (A) Coomassie blue-stained gel showing the albumin levels in spot urine samples from the time chasing experiments carried out in TG animals receiving doxycycline treatment for indicated durations. (B) Coomassie blue-stained gel showing the albumin levels in 24-hour urine samples from TG versus CON animals after 4 weeks of doxycycline treatment. n=3 in both groups. (C) ELISA quantitation showing the albumin levels in 24-hour urine samples from TG animals receiving doxycycline treatment for indicated durations. n=14 in all groups and quantitation of urinary albumin is relative to urinary creatinine levels (μg/μg). Dox, doxycycline.

