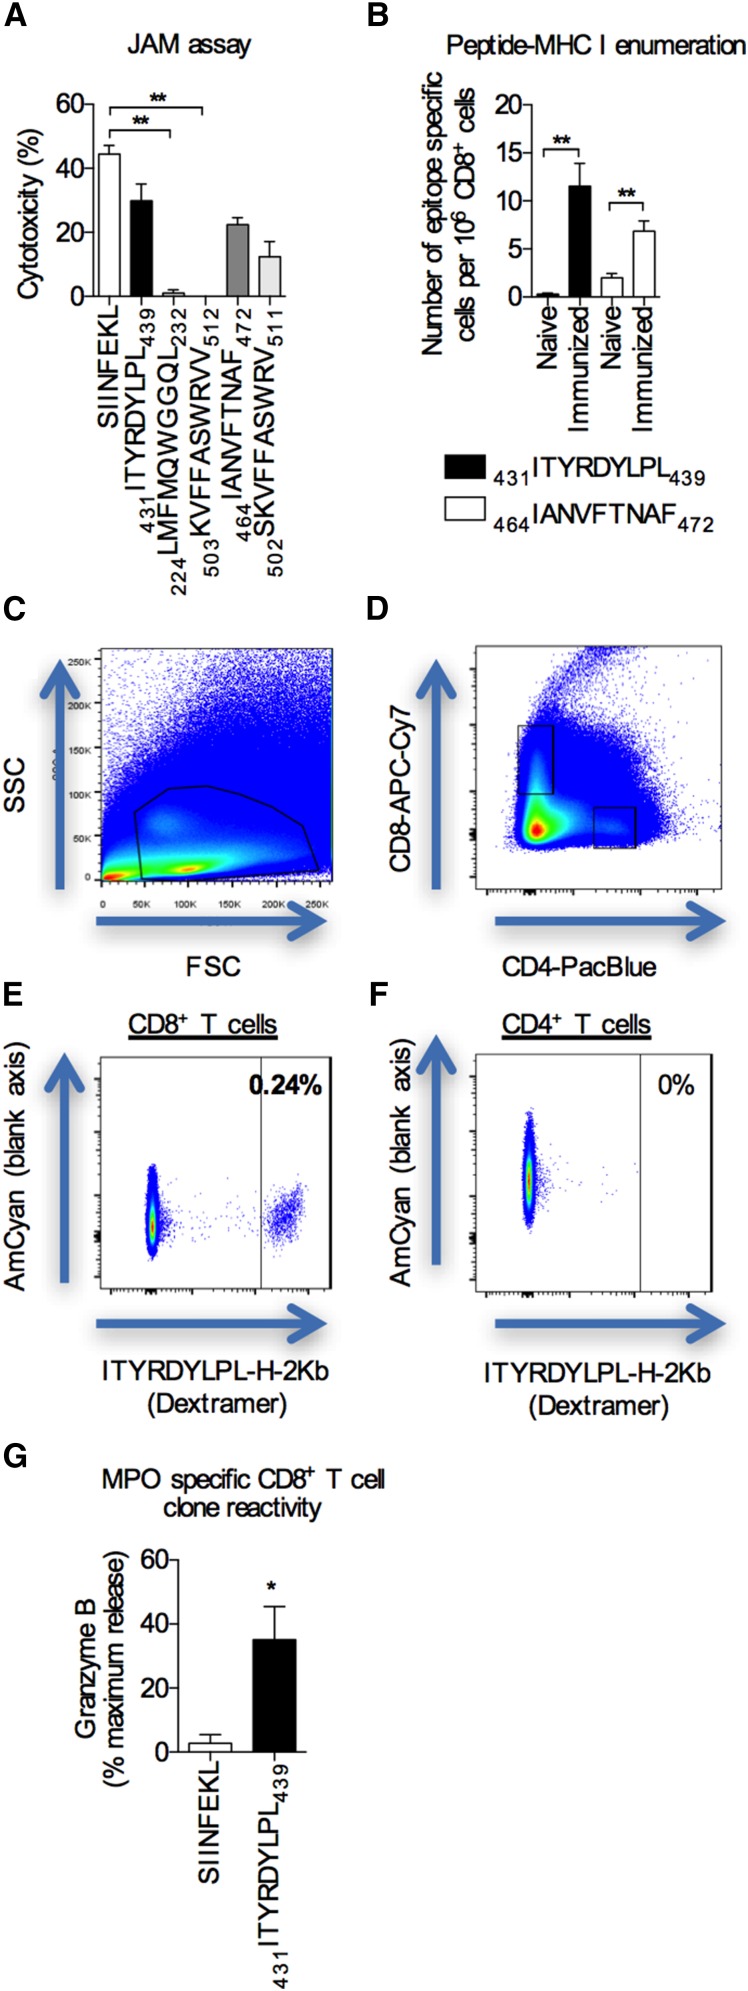
Figure 2.
Identification of potential MPO CD8+ cell epitopes and selecting MPO–specific CD8+ T cell clones. (A) The potential pathogenicity of MPO CD8+ T cell epitopes (x axis) was determined using a JAM assay using cells from mice immunized with the relevant peptides. The known CD8+ T cell epitope for OVA, SIINFEKL, was used as a positive control. Bar graphs represent the means±SEMs of four independent experiments performed in triplicate. **P<0.01 by one-way ANOVA. (B) The numbers of MPO epitope–specific CD8+ T cells in spleens and lymph nodes from either naïve or immunized (either 431ITYRDYLPL439 or 464IANVFTNAF472) mice were enumerated using peptide-MHC class I dextramers and expressed as numbers of epitope-specific cells per 106 CD8+ T cells. Bar graphs represent the means±SEMs of n=4 per group. **P<0.01 by unpaired t test. (C–F) Representative flow cytometry plots showing the gating strategy used to enumerate MPO epitope–specific CD8+ T cells post-tetramer enrichment. The MFI of the highest CD4+ T cell was used as the extent of the negative control to determine the gate cutoff for epitope–specific CD8+ T cells. In this example, after enrichment, 0.24% is equivalent to 14 epitope-specific cells per 1 million CD8+ T cells. (G) MPO-specific reactivity was measured by pulsing target EL4 cells with the MPO peptide, 431ITYRDYLPL439 (SIINFEKL-pulsed cells were used as a negative control), measuring granzyme B release using a colorimetric granzyme B assay, and expressing the data as percentages of maximum release (Triton X lysed cells). Bar graphs represent the means±SEMs of three independent experiments performed in triplicate. *P<0.01 by unpaired t test.

