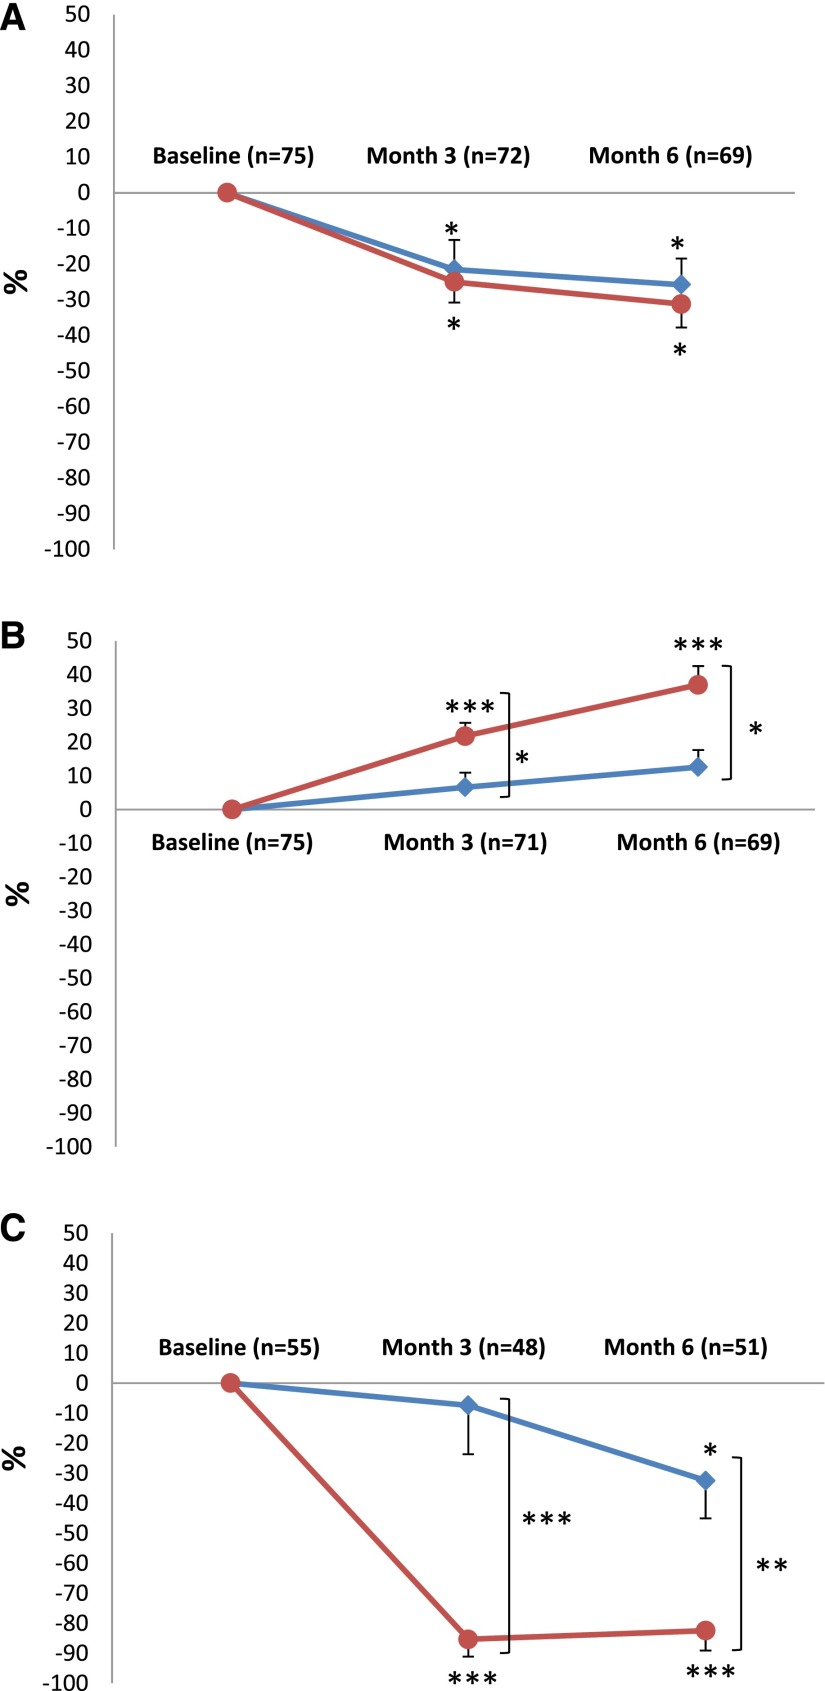
Figure 2.
The secondary end points are expressed as percentage changes in proteinuria, serum albumin, and PLA2R-Ab with time. Mean±SEM percentage changes from baseline in (A) proteinuria, (B) serum albumin, and (C) anti–PLA2R-Ab levels. Please note that C shows percentage changes of PLA2R antibodies in the subset of patients who had PLA2R-Ab at baseline. Bonferroni correction was applied; P value <0.02 indicates statistical significance. NIAT is shown by blue lines, and NIAT-rituximab is shown by red lines. *P<0.02; **P<0.001; ***P<0.001.

