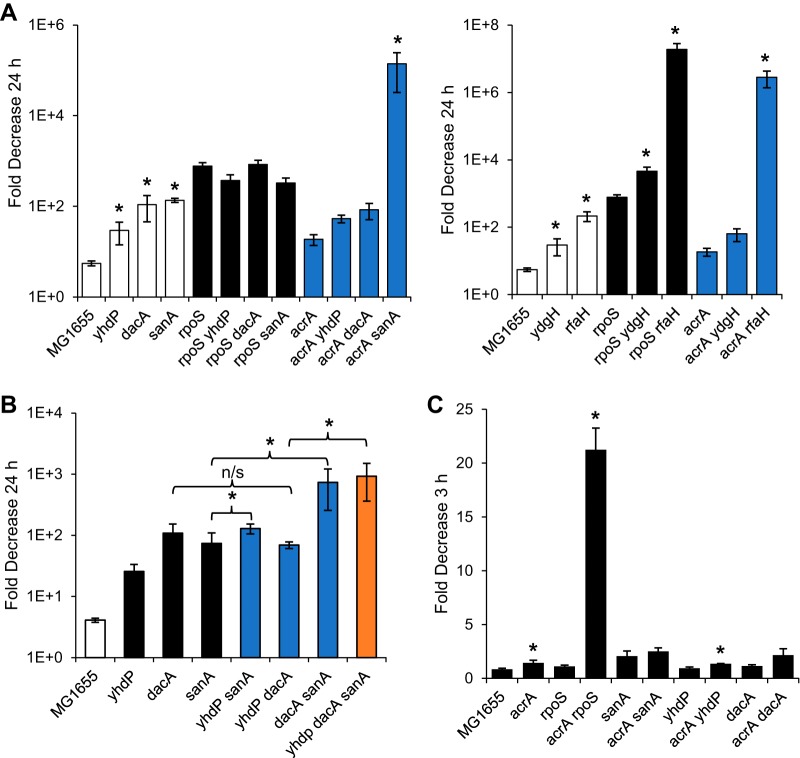
FIG 7.
rpoS is epistatic to sanA, dacA, and ydhP. (A) Carbon-limited cells of the indicated strains were treated with 2% SDS, and viability was assayed at 24 h posttreatment. The fold decrease in the treated samples versus the untreated samples is shown (untreated sample/treated sample). Open bars indicate strains in a wild-type background, while black bars indicate strains in an rpoS background and blue bars indicate strains in an acrA background. Control samples (MG1655 and rpoS and acrA strains) are identical between the two panels and include six biological replicates. Strains are separated by those that are not additive with rpoS (left) and those that are additive with rpoS (right). *, P < 0.05, one-tailed test for increase compared to the parent strain with the greater effect. (B) Carbon-limited cells of the indicated strains were treated with 2% SDS, and viability was assayed at 24 h posttreatment. The fold decrease in the treated samples versus the untreated samples is shown (untreated sample/treated sample). The control strain is indicated by a white bar, the single mutants by black bars, double mutants by blue bars, and the triple mutant by an orange bar. *, P < 0.05, one-tailed test for increase compared to the parent strain; n/s, no significant difference between the indicated strains. (C) Nitrogen-limited cells of the indicated strains were treated with 2% SDS, and viability was assayed at 3 h posttreatment. The fold decrease in the treated samples versus the untreated samples is shown (untreated sample/treated sample) on a linear scale. *, P < 0.05, one-tailed test for increase in strain without acrA compared to strain with acrA.

