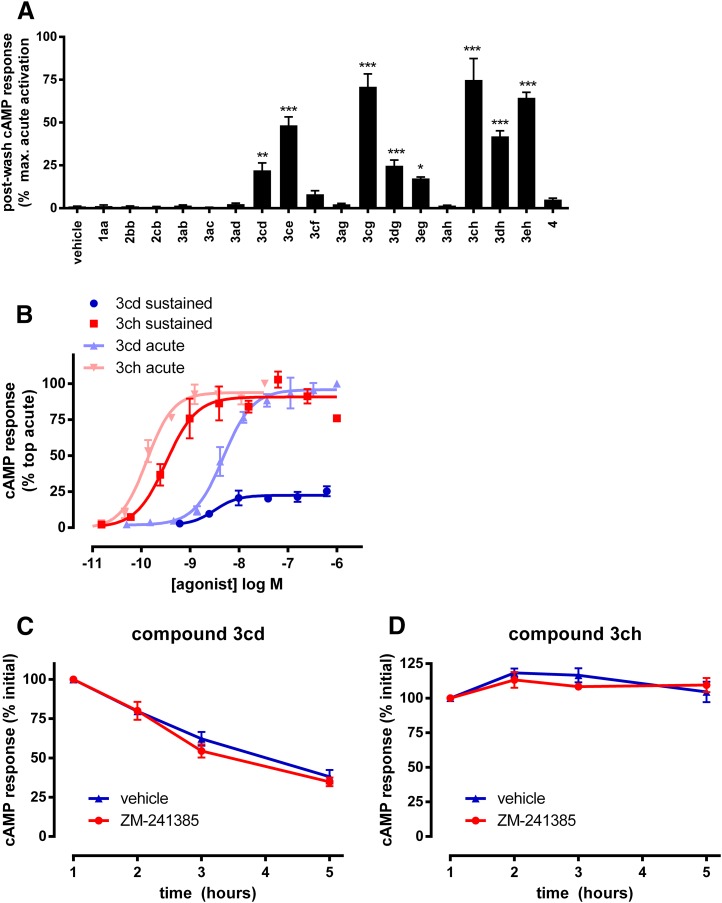
Fig. 1.
Sustained wash-resistant A2A agonist response measured by physically isolating agonist pre-treated cells from the original treatment vessel. (A) Cells were pre-treated with 20× EC90 concentrations of each agonist for 2 hours before washout and incubation in drug-free buffer for 1 hour (37°C) and measurement of cAMP capture by subsequent inclusion of rolipram. Sustained cAMP responses are normalized to acute responses (20× EC90 of 3cd) measured in parallel in the same population of pre-treated cells. *P < 0.05, **P < 0.01; ***P < 0.001 determined by ANOVA with Dunett’s post-test compared with vehicle control pretreated cells. (B) Concentration-responses analysis of postwash residual effects of 3cd (blue circles) and 3ch (red squares). Cells were pretreated with the indicated concentrations of agonist before residual cAMP response measured after washout. Responses are normalized to acute responses by direct application of 3cd. For direct comparison, the acute pharmacological responses of 3cd (light blue triangles) and 3ch (light red triangles) in the GloSensor cAMP assay are shown alongside. (C and D) Time course of sustained responses after pretreatment with EC90 concentrations of 3cd (C) or 3ch (D) after washout, with (red circles) or without (blue triangles) subsequent inclusion of antagonist (100 nM ZM-241385) for the indicated time. Responses are normalized to responses measured at 1 hour postwash. Data represent an average ± S.E.M. of 3–5 experiments performed in triplicate.

