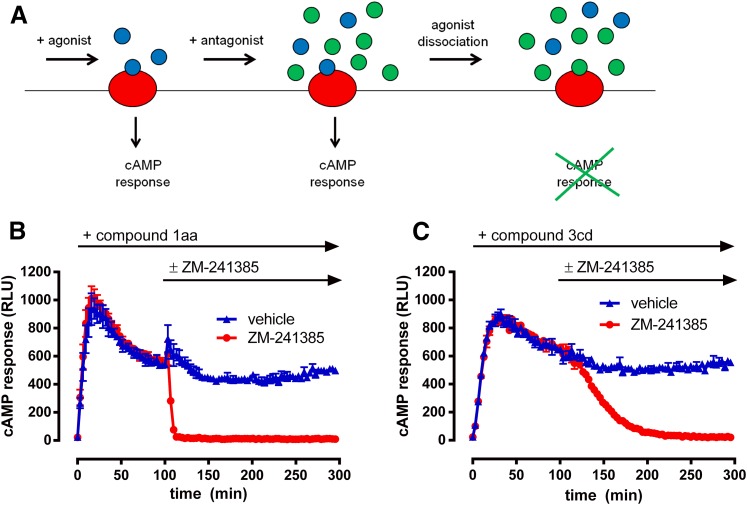
Fig. 2.
Explanation and demonstration of the GloSensor reversal assay used to estimate agonist dissociation rate. (A) Schematic cartoon describing the system. Cells are first incubated with agonist (blue circles) to permit assumed equilibrium binding to receptors (red circles), which generates a relatively stable cAMP response. Excess antagonist (green circles) is then directly added to the cells. Upon dissociation of the agonist from the receptor, antagonist then occupies the binding site and prevents further activation by the agonist. This causes cessation of cAMP responses, at a rate that is dependent upon agonist dissociation kinetics. (B and C) Sample GloSensor reversal traces for 1aa (B) and 3cd (C) demonstrate that reversal rate is agonist dependent. Upon incubation of agonist (EC90) and generation of relatively stable cAMP responses for 100 minutes, addition of vehicle control (blue triangles) has little effect on responses for a further 200 minutes. However, addition of antagonist at 100 minutes (red circles; 100 nM ZM-241385) causes a complete reversal of cAMP response to basal levels. 1aa reversal is faster, consistent with a more rapid off-rate compared with 3cd. Data represent an average of three experiments performed in triplicate.

