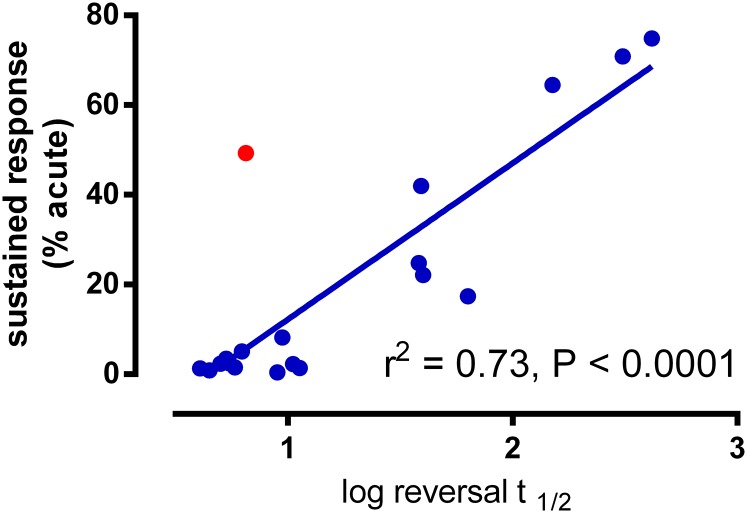
Fig. 4.
Correlation of sustained wash-resistant agonist responses and the reversal rates of agonists in the GloSensor assay. Linear regression plot of log converted reversal t1/2 values (from Table 2) against sustained responses (from Fig. 1A above). Compound 3ce is represented as a red circle, to highlight that is an outlier. Data from Table 2 is plotted on the x-axis and data from Fig. 1A is plotted on the y- axis.

