Fig. 7.
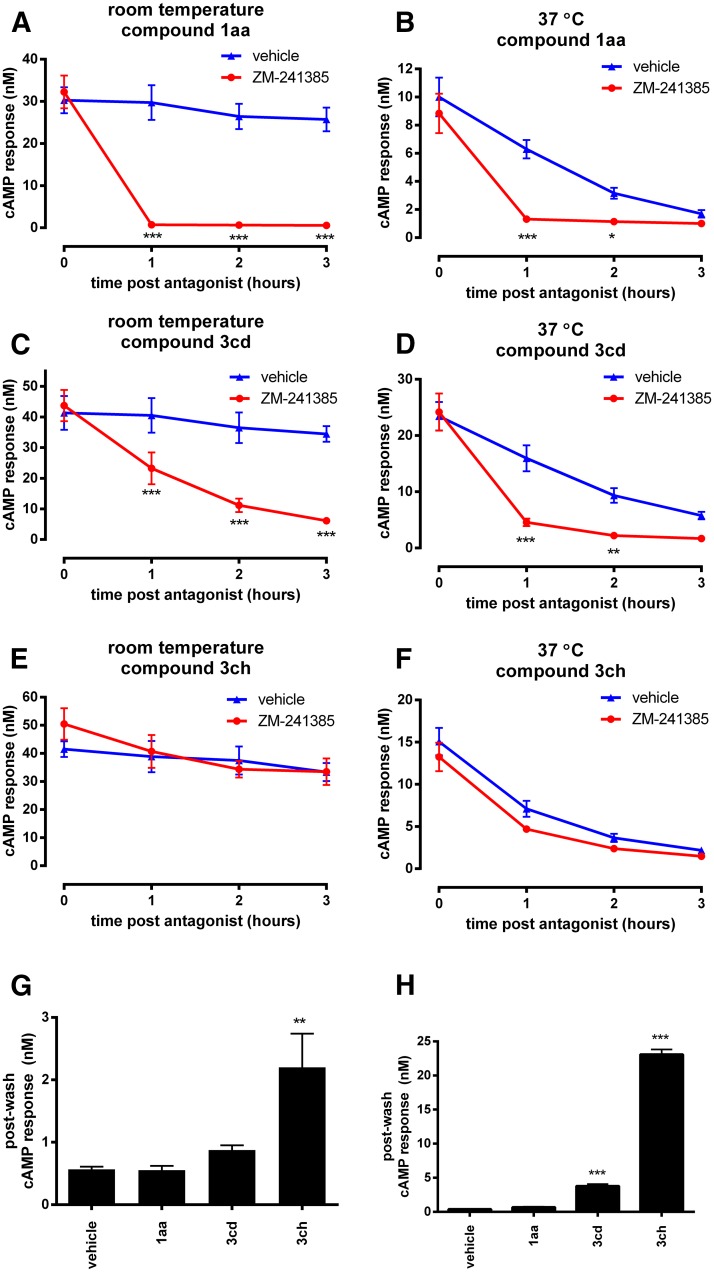
Temporal response profiles of A2A agonists at endogenously expressed receptors in SH-SY5Y cells using the endpoint cAMP assay. (A–F) Time course experiments determining agonist responses stability and the ability of an antagonist (100 nM ZM-241385) to reverse these. Experiments were performed at either room temperature (A, C, E) or 37°C (B, D, F). Cells were incubated with EC90 concentrations of 3cd (A, B), 3ch (C, D), or 1aa (E, F) for 100 minutes, before direct addition of antagonist (red) or vehicle (blue) in a 1:10 dilution and further incubation for the indicated times, followed by direct addition of rolipram (in a 1:1 dilution) for 45 minutes. *P < 0.05, **P < 0.01; ***P < 0.001 as determined by repeated-measure ANOVA with Bonferroni’s post-test comparing antagonist versus vehicle treated responses for the each time point. (G–H) Sustained agonist responses measured in washout experiments. Suspensions of SH-SY5Y cells were pre-treated with 20× EC90 concentrations of each agonist (2 hours) at 37°C (G) or room temperature (H) before washout and recovery in drug-free buffer for 1 hour (37°C) and measurement of cAMP capture by subsequent inclusion of rolipram at the relevant temperature. **P < 0.01; ***P < 0.001 determined by repeated-measure ANOVA with Dunnett’s post-test compared with vehicle control.

