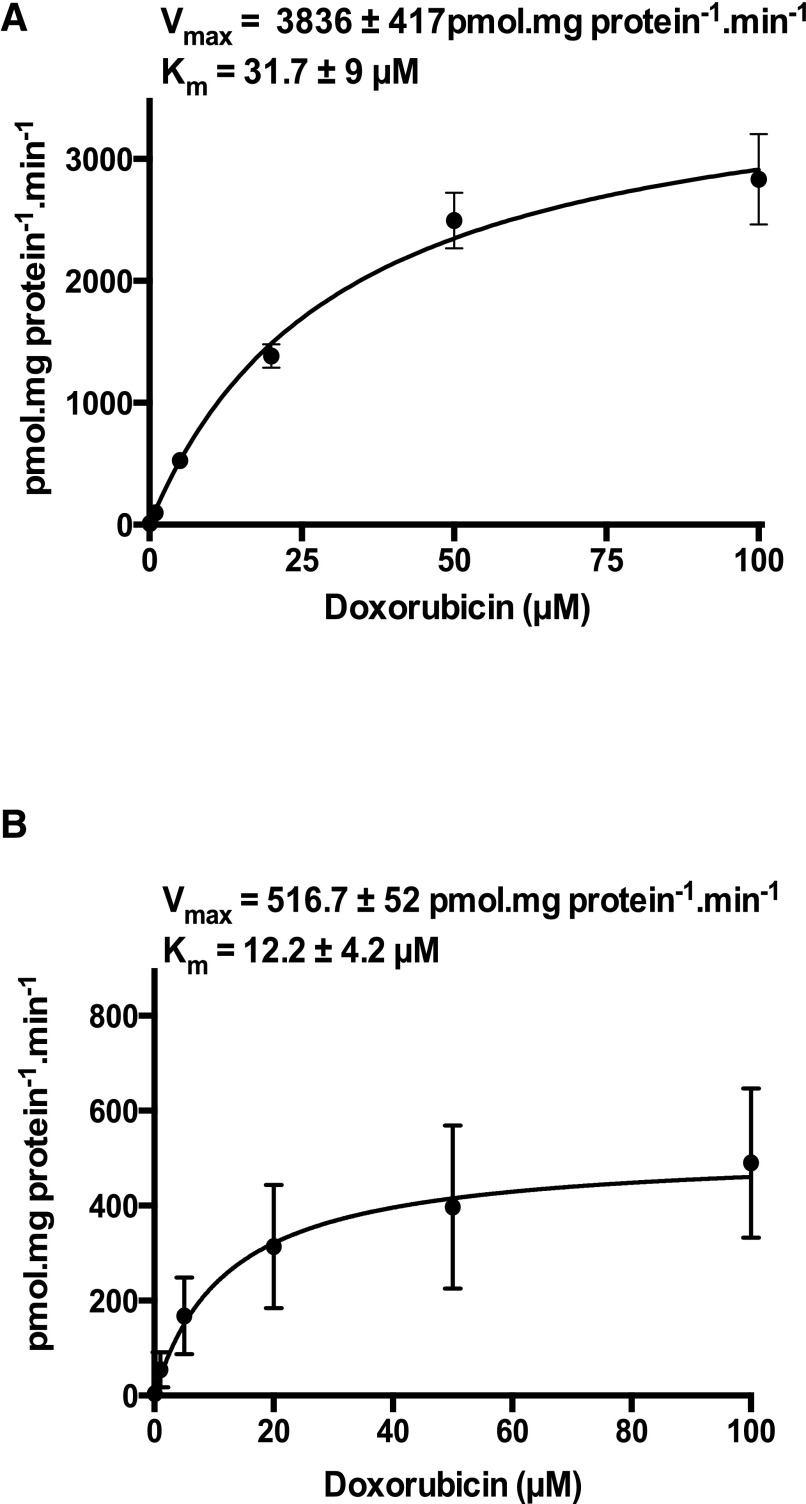
Fig. 2.
Doxorubicin transport kinetics. Transport kinetics of OATP1A2 (A) and Oatp1a4 (B) after transient heterologous expression in HeLa cells at varying concentrations of doxorubicin (0.1–100 µM). Parameters for saturation kinetics (Vmax and Km) were estimated by Michaelis-Menten-type nonlinear curve fitting. Data are expressed as mean ± S.E. (n = 8).

