Fig. 4.
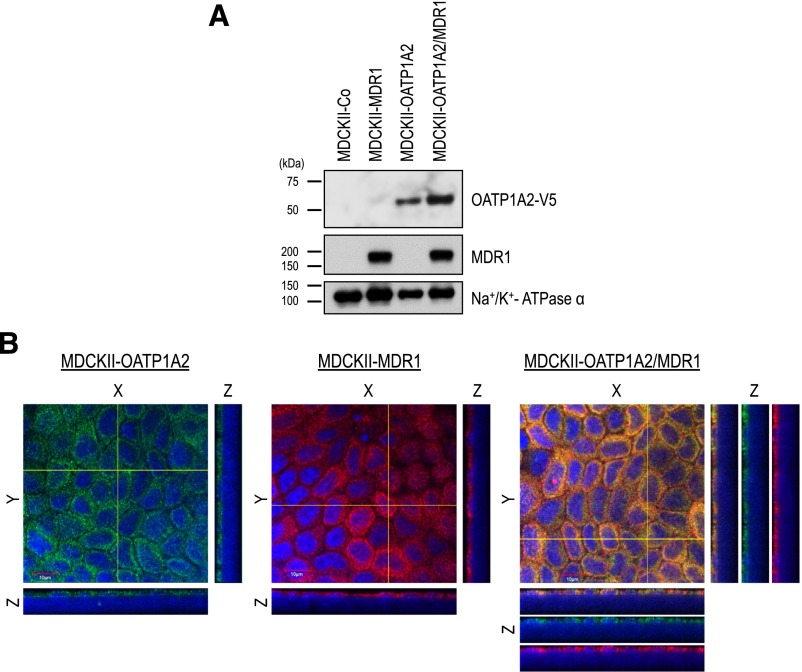
Protein expression of OATP1A2 and MDR1 in single (OATP1A2 and MDR1)- and double (OATP1A2/MDR1)-transfected MDCKII cells. Crude membrane proteins were prepared and applied to SDS-PAGE, followed by immunoblot analysis (A). An anti-V5 antibody detected OATP1A2 as a single band with MW ∼58 kDa. MDR1 showed the predicted MW ∼170 kDa. To confirm cell surface expression of OATP1A2 and MDR1, immunofluorescence confocal microscopy (B) was conducted. Membrane localization of human OATP1A2 and MDR1 in single-transfected MDCKII-OATP1A2 and MDCKII-MDR1 cells and double-transfected MDCKII-OATP1A2/MDR1 cells is shown. Cells stably transfected with OATP1A2 cDNA constructs were single or double stained with a rabbit polyclonal anti-human OATP1A2 antibody (green fluorescence) and/or a mouse monoclonal anti-human MDR1 antibody (red fluorescence). Nuclei were stained with DAPI (blue fluorescence). Pictures are single optical sections (X/Y) (center) with X/Z (bottom) and Y/Z (right) projections, respectively. Dotted line indicates the position where Y-Z and X-Z images locate. Scale bar = 10 μm (in X-Y image). 60× objective.

