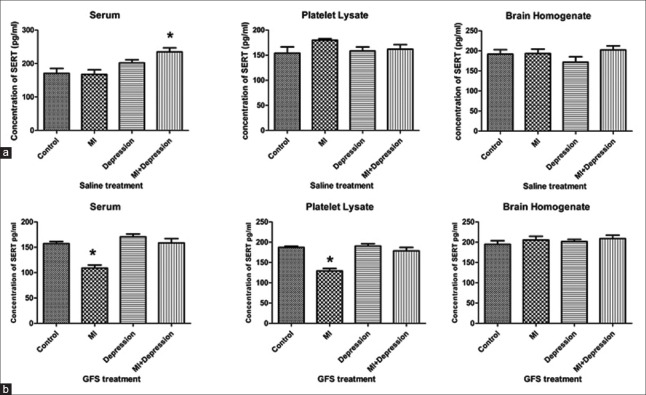
Figure 3.
Concentrations of SERT in serum, platelet lysate, and brain homogenate after saline (a) and GFS (b) treatments in MI, depression, MI + depression, and control groups. *P < 0.05, versus control group. n = 10 in each subgroup of control and depression groups, and n = 8 in each subgroup of MI and MI + depression groups. SERT: Serotonin transporter; MI: Myocardial infarction; GFS: Ginseng fruit saponins.

