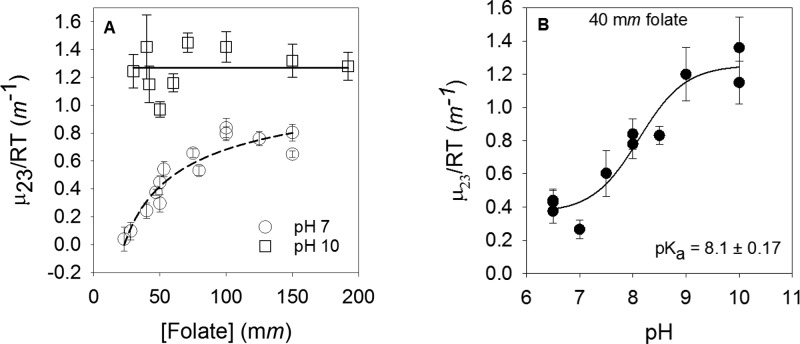
Figure 2.
Preferential interactions between folate and betaine show effects of folate concentration and pH. (A) Folate concentration dependence of μ23/RT at pH 7 (○) and pH 10 (□). A fit to eq 2 describing folate dimerization (R2 = 0.88) gave large errors for data at pH 7, and no concentration dependence was noted at pH 10; thus, the lines provided are to aid the eye. (B) pH dependence of μ23/RT values for 40 mm folate (●). The data were fit to eq 3 with an R2 of 0.93 to yield a pKa describing deprotonation of the N3–O4 enol tautomer.

