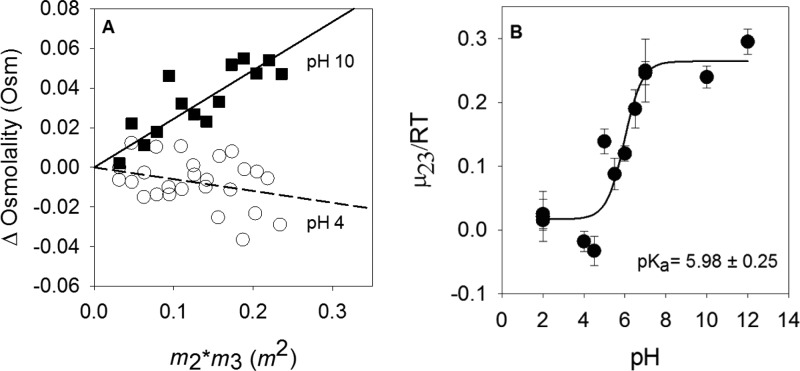
Figure 4.
Vapor-pressure osmometry studies of pyridoxine showing pH effects. (A) Data for pyridoxine at pH 4 (○) and 10 (■). The dashed and solid lines represent the slopes of the plots for pH 4 and 10 data, respectively. (B) pH titration of μ23/RT for pyridoxine. Data were fit to eq 3, and best fit values are 0.017 ± 0.018 m–1 for the protonated form and 0.26 ± 0.02 m–1 for the deprotonated form.

