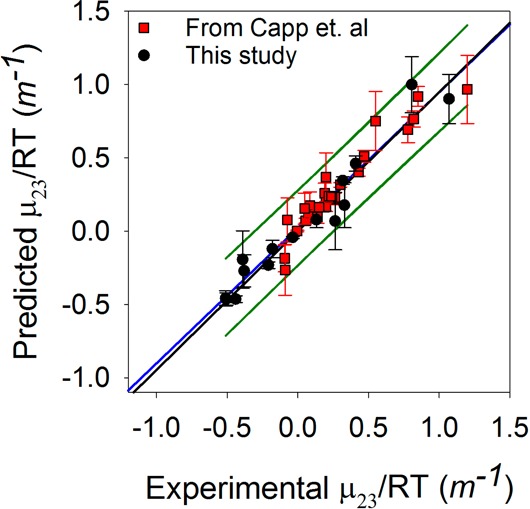
Figure 7.

Comparison of predicted μ23/RT values vs experimental μ23/RT values. The red squares are from ref (19), and the black circles are from our additional compounds. Many of our compounds have negative μ23/RT values. The black line shows a slope of 1 for a fit through 0,0. The blue line shows the best linear fit of the data with an R2 of 0.93. The 90% confidence intervals for the fit are shown as green lines.
