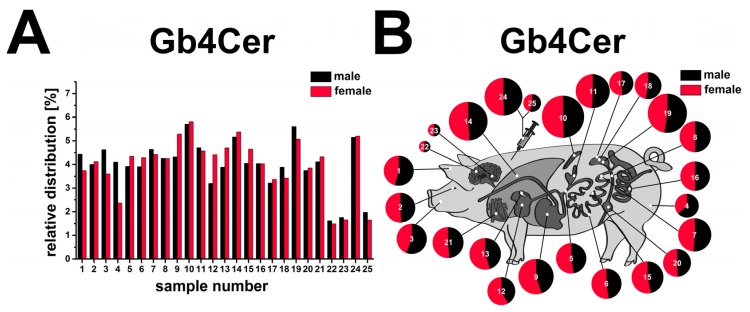
Figure 14.
Relative content of antibody-detected Stx2e receptor Gb4Cer in tissues and organs of male and female piglet. Gb4Cer distribution to the various tissues and organs of the male and the female piglet is depicted as a bar chart (A) in the order of the sample numbers from left to right according to Figure 4A (male piglet) and Figure 9 (female piglet) and as a schematic topographical atlas in the form of a cartoon map of pig tissues/organs (B). The size of the circle diameters corresponds to the relative Gb4Cer amount and the scale of the “pie slices” indicates the relative Gb4Cer content of the male (black) and the female animal (red).

