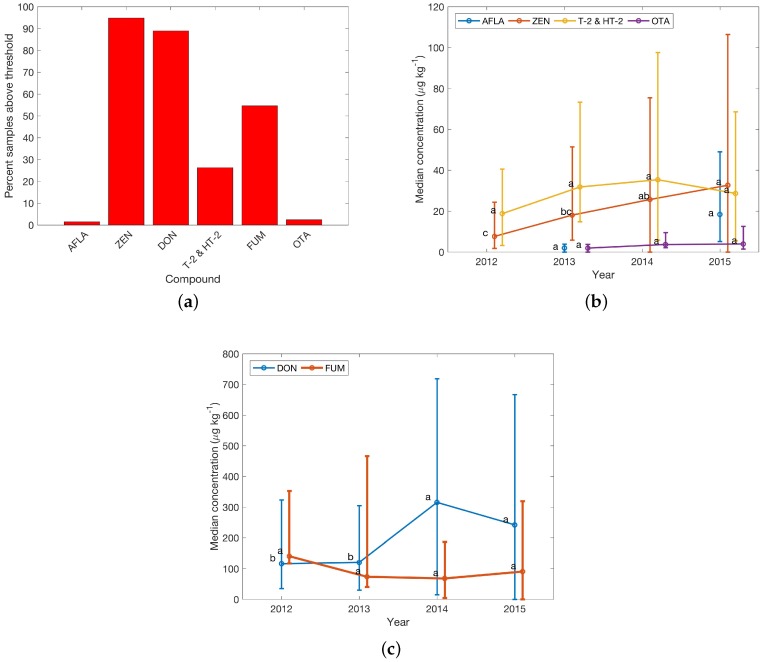
Figure 3.
Survey results for regulated toxins in finished feed samples in Central Europe. (a) Percentage of samples with concentrations above thresholds; see Table 1 for details; (b) and (c) Yearly median concentrations from 2012 to 2015 (missing point indicates that no data were available). Error bars reflect the Wilcoxon confidence interval (CI). Lower error were replaced with the median, if the Wilcoxon CI would have resulted in negative concentrations. Significance codes show differences between yearly medians from a Kruskal–Wallis test result. Different letters indicate a significant difference between the groups. Data points were offset on the x-axis for clarity. Sample numbers for calculation of the median of each year are availale in Table 3.

