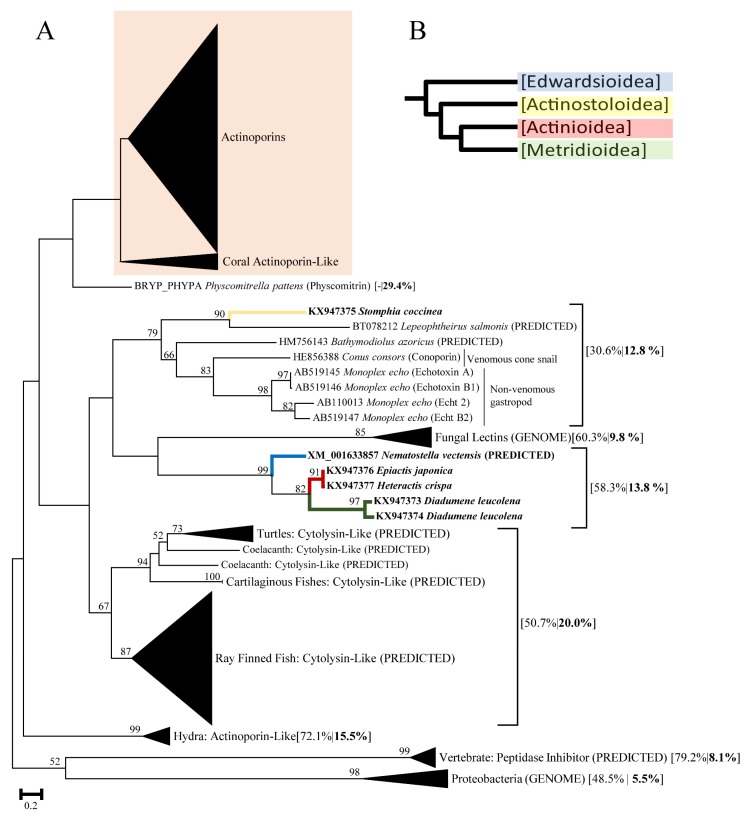
Figure 1.
(A) Maximum Likelihood tree of actinoporins and actinoporin-like proteins produced in FastTree2. Numbers on branches represent bootstrap values of 1000 replicates. Bootstrapping values greater than 50 are shown at the nodes. Branch labels of clustered gene groups represent lineage common names followed by percent identity (identical amino acid residues) within gene cluster and percent identity when compared to actinoporins in bold. Labeled individual branches show GenBank accession followed by species, and protein name (if applicable). Labels denoted with PREDICTED or GENOME indicate that they were derived bioinformatically in GenBank and are not validated proteins. Branch labels with Genbank accession and species for sea anemones are indicated in bold. The colored box indicates which actinoporin sequences were used in subsequent analyses; (B) Phylogenetic tree with branch colors depicting superfamily associations (Blue: Edwardsioidea, Yellow: Actinostoloidea, Red: Actinioidea, Green: Metridioidea) [42].

