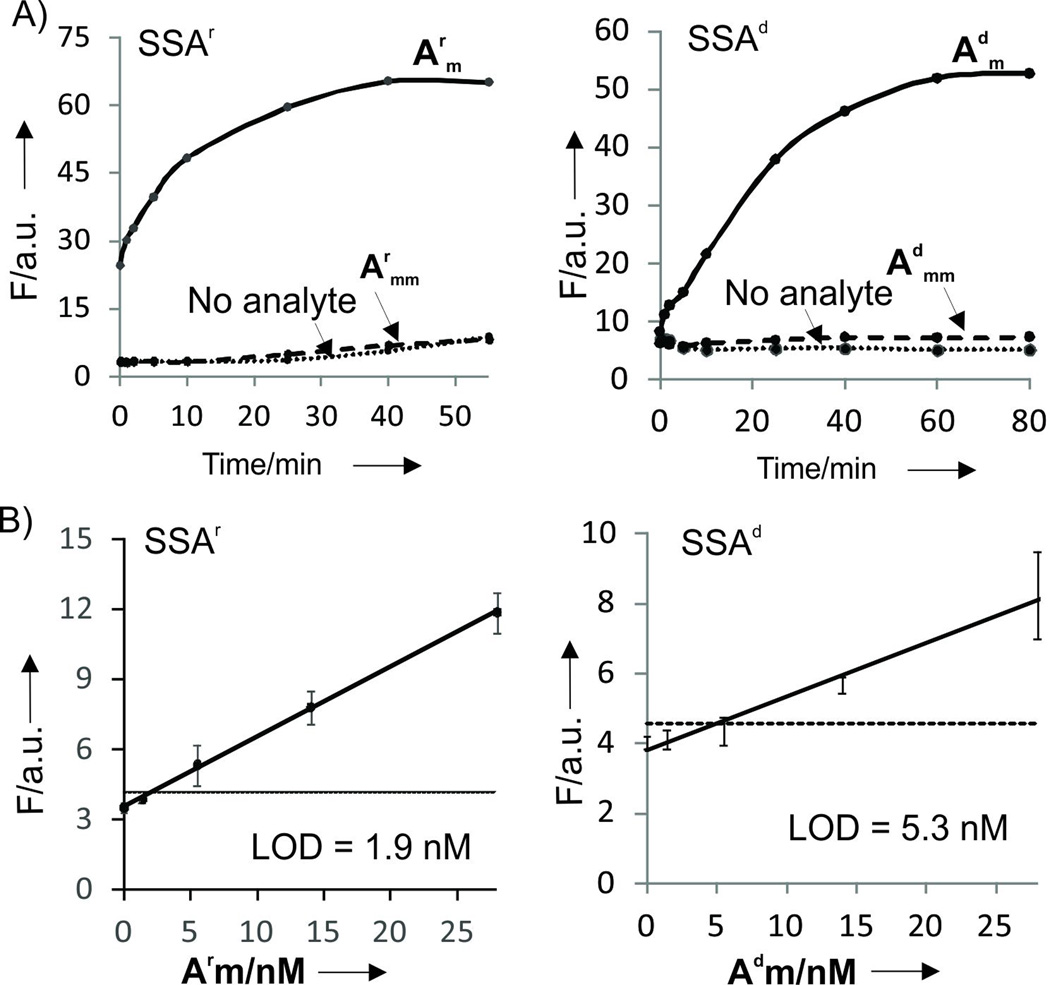
Figure 2.
Kinetics and limit of detection (LOD) of the SSA probes. A) Time dependence of fluorescent response of SSAr and RNA analytes (left) and SSAd and DNA analytes (right). The apparent difference in signal-to-noise ratio in comparison with Figure 1 B and C is due to the different analyte concentrations. Reaction mixtures contained: 1 µM DFHBI, 2.6 µM SSAr_m and 3.6 µM SSAr_f, 275 nM RNA analytes; or 2 µM DFHBI, 2 µM SSAd_m and 3.6 µM SSAd_f, 275 nM DNA analytes. B) Limits of detection (LOD) for SSAr and SSAd after 30 min of incubation. Averaged data from three independent experiments with standard deviations are presented.

