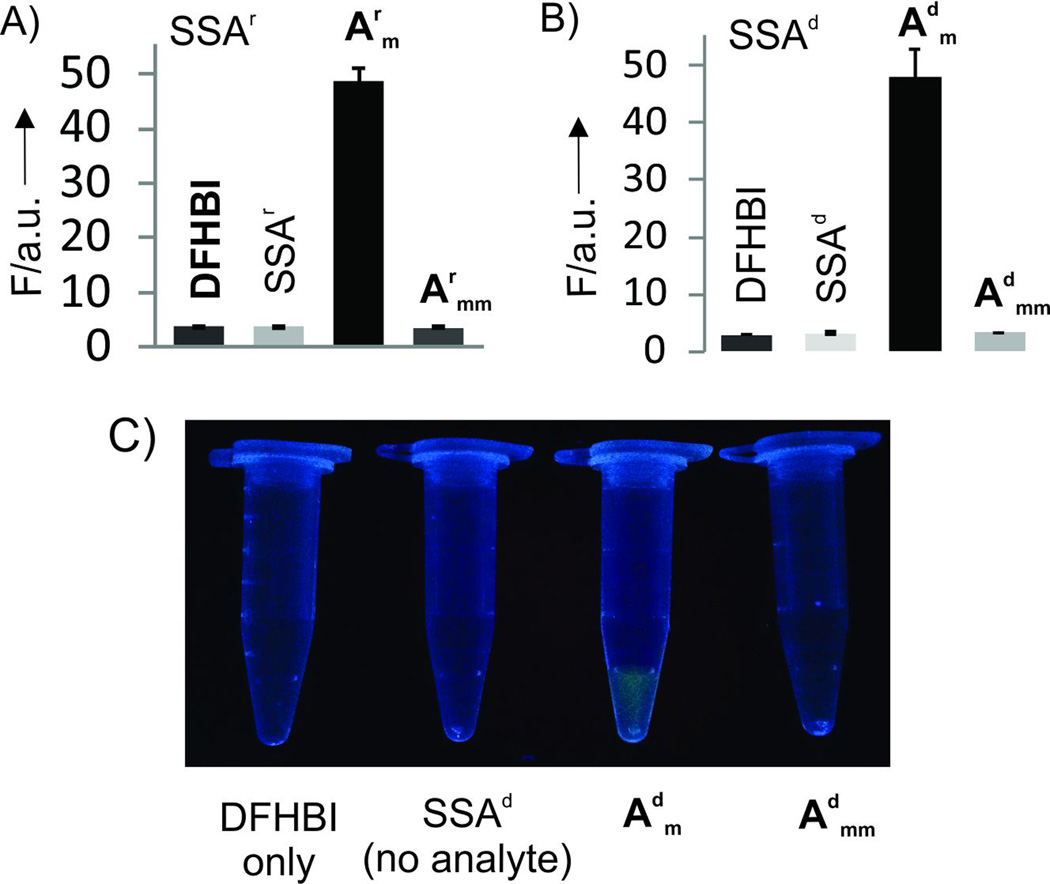
Figure 3.
Selectivity of the SSA probes. A) Fluorescence response of SSAr in the presence of 100 nM of either matched (Arm) or single base mismatched (Armm) RNA analytes. B) Fluorescence response of SSAd in the presence of 100 nM of either matched (Adm) or single base mismatched (Admm) DNA analytes. The data are average values of 3 independent experiments with standard deviations. C) Photograph of the SSAd samples from panel B upon excitation with transilluminator. The controls samples were as follows: DFHBI, DFHBI dye only; SAA, DFHBI dye, SSA_m, and SSA_f (no analyte). The concentrations were as specified in Figure 2 legend.

