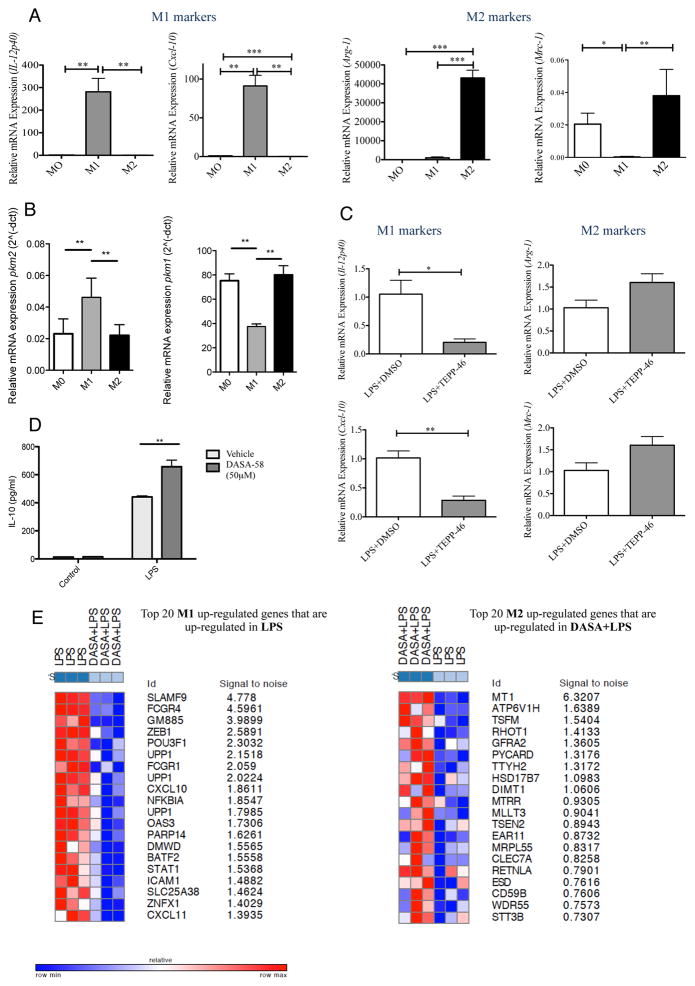
Figure 2. Activation of PKM2 using TEPP-46 attenuates the M1 attributes of LPS-activated BMDMs.
BMDMs were stimulated with 100ng/ml LPS or 20ng/ml IL-4 for M1 and M2 polarization respectively. 24 hours after stimulation RNA was extracted. (A) Left to right, expression of il12-p40, cxcl-10, arginase-1 and mrc-1 were analyzed to assess differentiation into M1 and M2 macrophages. (B) Expression of pkm2 (left) and pkm1 (right) was measured for each polarizing condition. (C) BMDMs were pretreated with 100μM TEPP-46 or DMSO (1hr), followed by LPS (24h). RNA was extracted and expression of il12-p40, cxcl-10, arginase-1 and mrc-1 was analyzed. (D) IL-10 expression measured in supernatants from BMDMs ± DASA-58 (50μM, 30min) followed by LPS (24h). Data represents Mean ± SEM, n=3, **p<0.01. (E) Transcriptomics dataset profile GSE53053 used to identify genes that were significantly up- or down- regulated in M1 or M2 polarizing conditions (Two tail Two sample T-test; nominal p-value <=0.05, Absolute log2-fold-change >= 2-fold). A chi-square test was performed to identify sets of up- or down- regulated genes with significant patterns from microarray data (Figure S1) comparing LPS+DASA-58 to LPS treated macrophages.

