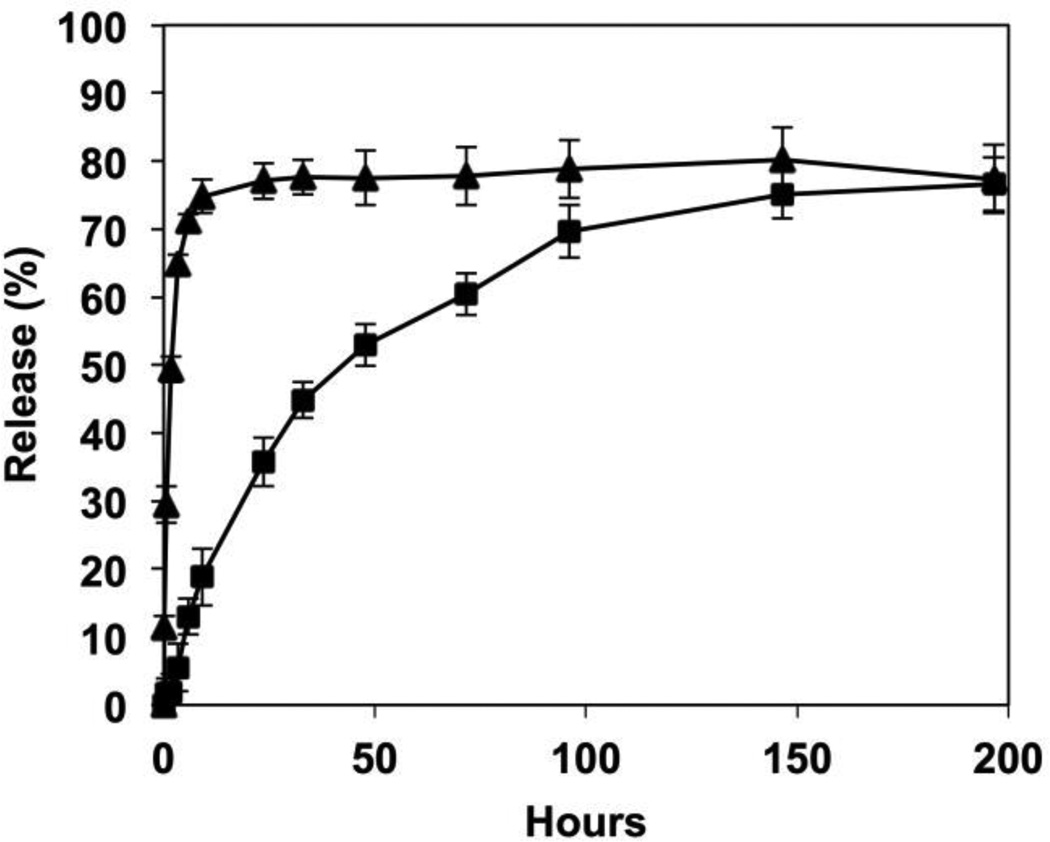
Figure 3.
Plot showing percent release versus time for the release of compounds E22 (triangles) and DMABI (squares) from SLIPS-coated surfaces incubated in PBS buffer at 37 °C. Data points represent the mean of four replicates. The percentage of each compound released was calculated based on the total amount of compound initially loaded.

