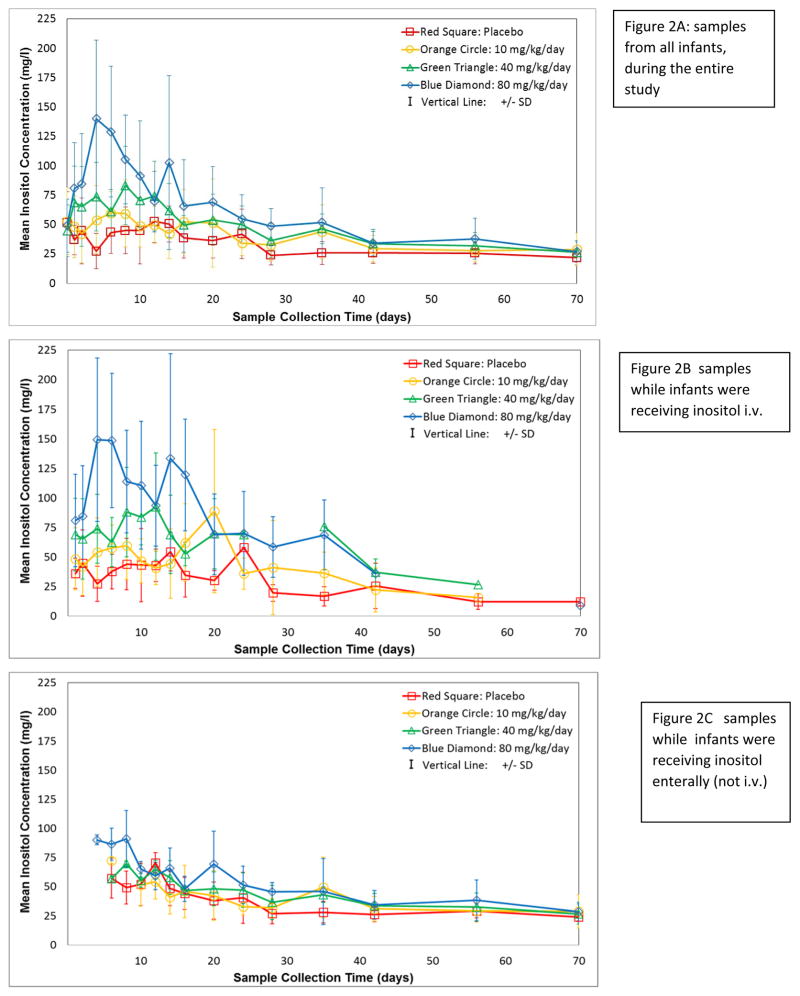
Figure 2. Serum Inositol Levels.
Mean±SD, by dose, clustered by days on study. Symbols: 80mg/kg/day = blue diamond, 40mg/kg/day = green triangle, 10mg/kg/day = orange circle, placebo = red square. Panel A includes all samples; panel B values only while subjects were receiving IV doses; panel C values obtained only when subjects were receiving enteral dosing. Timed samples were collected within scheduled windows (see Methods), plus additional scavenged laboratory residual samples as available and if exact timing after the previous dose was known for the sample. For presentation, collection days are clustered in mean values to simplify display: Study Day 0=baseline before 1st infusion; Day 2= 1st sample after 1st infusion; day 3=3rd study day; day 4=4–5d; day 6=6–7d; day 8=8–9d; day 10=10–11d; day 12=12–13d; day 14=14–15d; day 16=16–18d; day 20=19–22d; day 24=23–26d; day 28=27–31d; day 35d=32–38d; day 42=39–48d; day 56=49–63d; day 70=64–77d. Plotting only peak values, or only trough levels did not assist in displaying the data.

