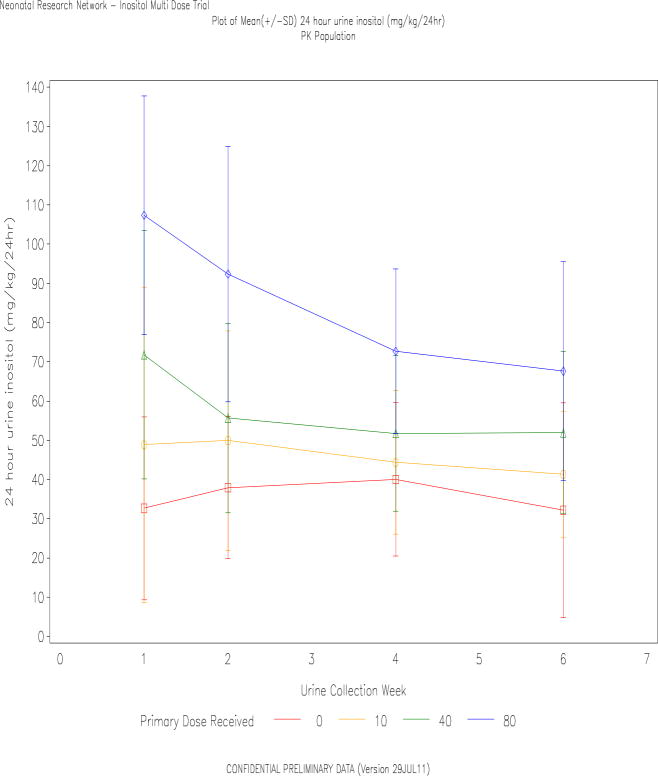
Figure 3. Inositol Urine Losses.
Inositol in the urine from each diaper (Concentration × Volume) was summed over 24hr to determine the urine losses, at weekly intervals. Data are mean±SD, and slightly offset for better visualization. Symbols: Square=placebo, circle=10mg/kg/day, triangle=40mg/kg/day and diamond=80mg/kg/day.

