
Figure 3.
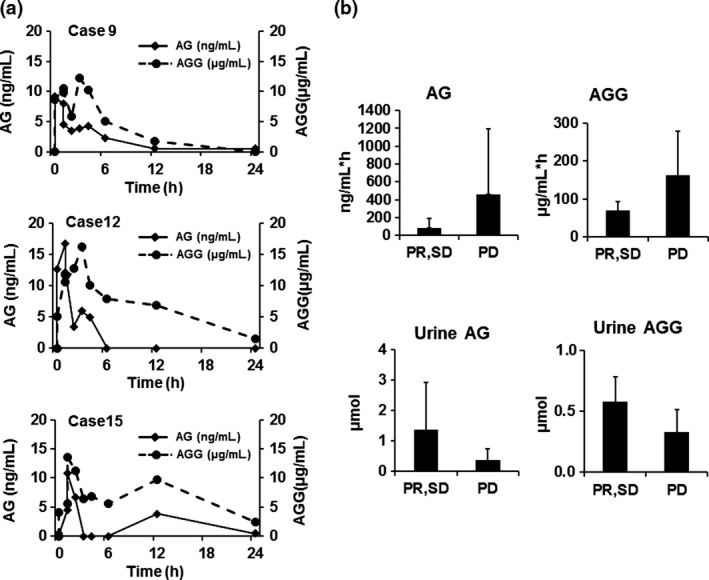
Pharmacokinetic profiles of arctigenin (AG) and arctigenin glucuronide (AGG) and their relation to clinical outcome. (a) Representative pharmacokinetic profile on day 1 of three patients treated with 12.0 g GBS‐01 (level 3) who showed stable disease (case 9) and progressive disease (cases 12 and 15). Solid line, plasma concentration of AG; dotted line, plasma concentration of AGG. (b) Correlation analyses of plasma AG area under the curve, AGG area under the curve, urinary output of AG in 24 h, and urinary output of AGG in 24 h. Patients were stratified into two groups, partial response/stable disease (PR/SD) and progressive disease (PD), according to their clinical responses. Bars show mean and error bars show standard error.