Figure 1.

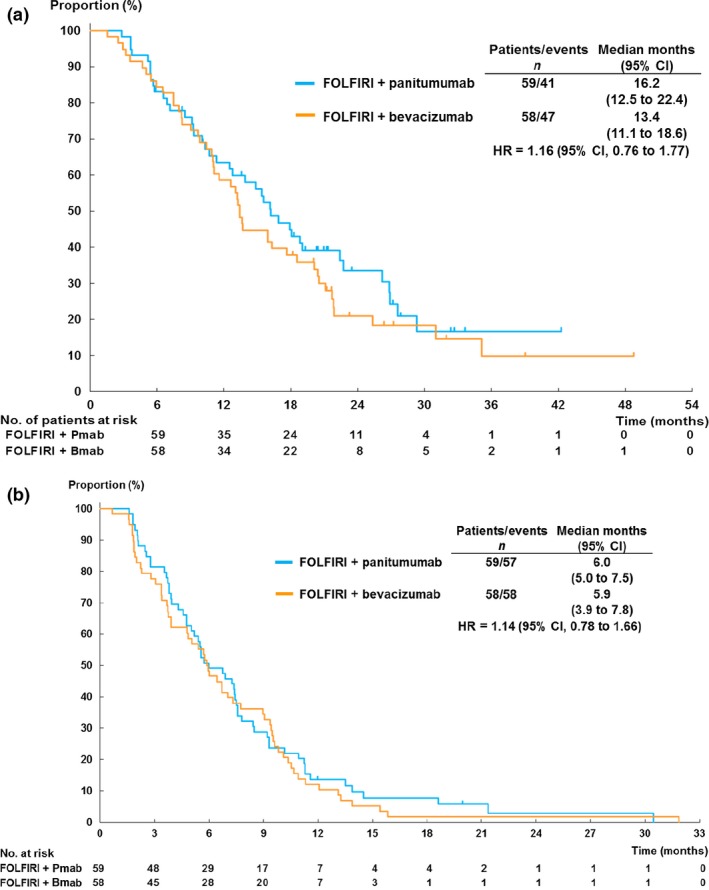
Kaplan–Meier plots of (a) overall survival and (b) progression‐free survival in the full analysis set cohort. Bmab, bevacizumab; CI, confidence interval; HR, hazard ratio; Pmab, panitumumab.

Kaplan–Meier plots of (a) overall survival and (b) progression‐free survival in the full analysis set cohort. Bmab, bevacizumab; CI, confidence interval; HR, hazard ratio; Pmab, panitumumab.