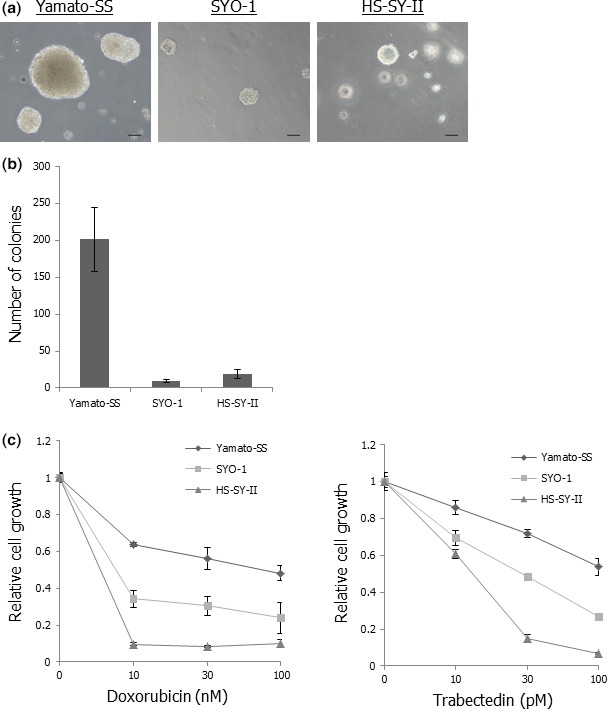
Figure 2.

Yamato‐SS cells show higher anchorage‐independent growth ability and lesser sensitivity to chemotherapeutic agents than SYO‐1 or HS‐SY‐II cells. (a) Colony formation in three SS cell lines. Scale bars: 100 μm. (b) Numbers of colonies in three SS cell lines. Columns, mean; bars, SD. (c) Sensitivities of three SS cell lines to doxorubicin or trabectedin. The SS cells were exposed to different concentrations of doxorubicin or trabectedin for 72 h. Cell viability was determined by WST‐1 assay and relative cell growth was calculated. Points, mean; bars, SD.
