
Figure 1.
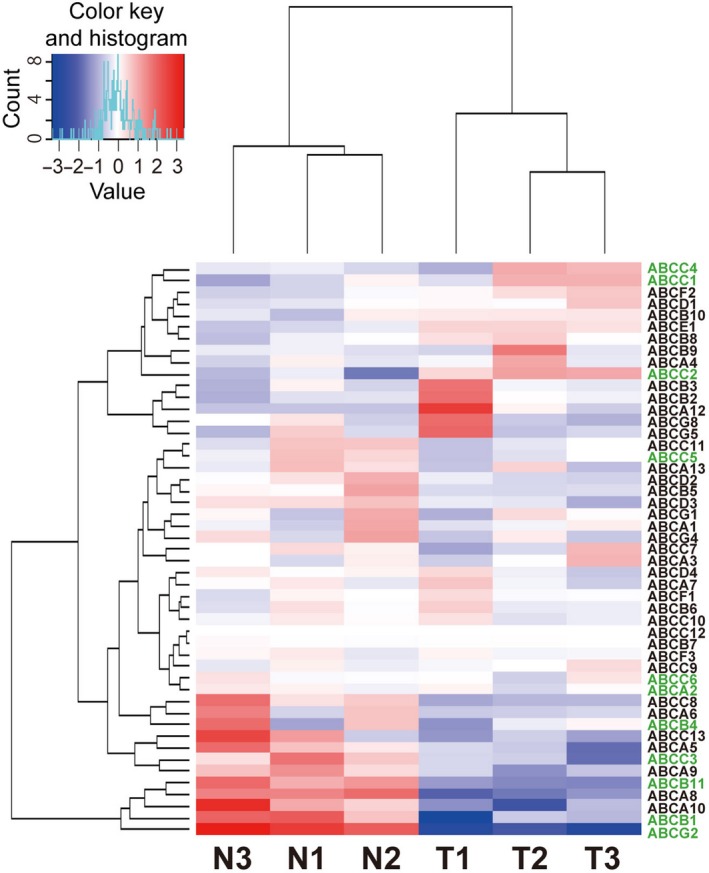
Heat map and cluster analysis of gene expression profiles for 48 ABC transporters in normal colon and colon cancer tissue. Each row represents an ABC transporter gene, and each column represents a clinical sample. N and T indicate paired normal and tumor tissue specimens, respectively. Genes and samples are arranged according to their similarity in expression levels determined by RNA‐seq. The expression level of each gene was standardized by subtraction of the mean log2(expression level) for the six samples from each value and is colored blue, white, or red to represent a low, moderate, or high level, respectively. Gene names colored green are analyzed in Fig. 2.