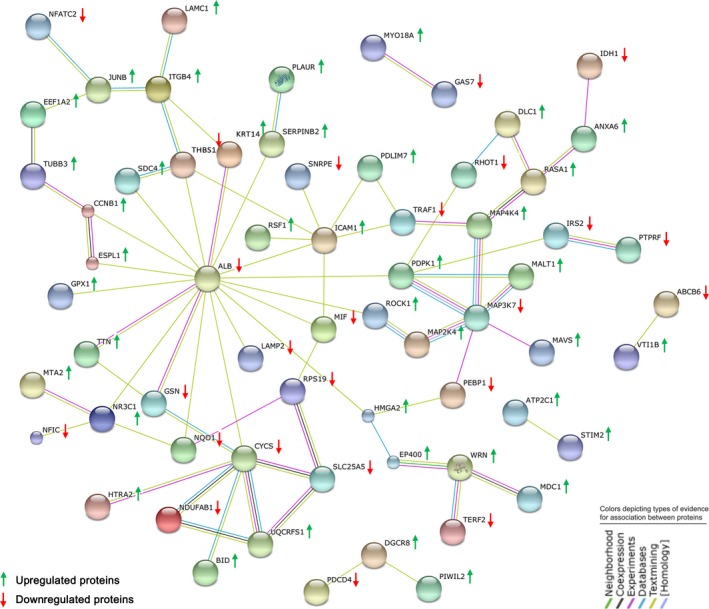
Figure 4.

Network analysis of differentially expressed proteins associated with “cell death and survival” after MAGEC2 deletion using the String 9.1 program. Red arrows represent downregulated proteins, and green arrows represent upregulated proteins in MAGEC2‐knockout A375 cells.
