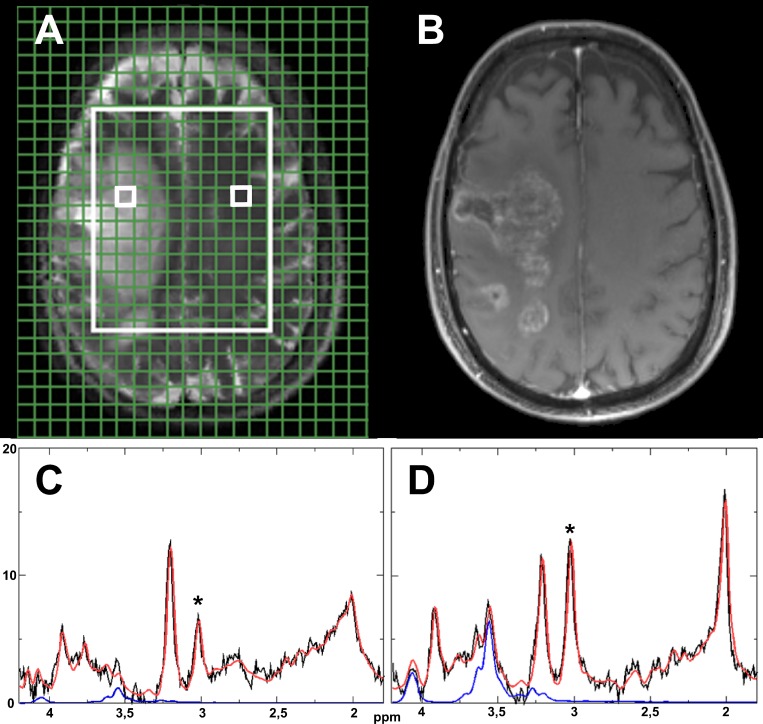
Fig 1. Model spectra.
Graphical user interface on T2-weighted MR image with two small white boxes indicating an example voxel for tumor (left) and control tissue (right) within the measured area (large white box) (A). Corresponding T1-weighted contrast enhanced MR image (B).Corresponding spectra for the marked tumor (C) and control tissue voxels (D). The original signal is shown in black, the LCModel fit in red and the isolated signal for myoinsitol in blue. A * marks the creatine peaks.

