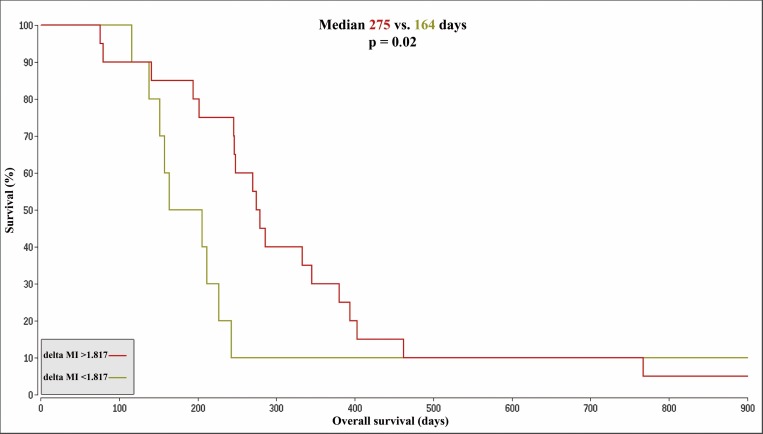
Fig 4. Kaplan-Meier-Curves based on delta MI.
Kaplan-Meier-Curves for patients with delta MI values > 1.817 (OS 275 days, color: red) compared to patients with values < 1.817 (OS 164 days, color: brown). The figure shows an extract with an OS of 1829 days for the remaining patient of the brown cohort and a censored survival of 1424 days for the one remaining patient in the red cohort. MI = Myoinositol; OS = overall survival; delta MI = MI control tissue minus tumor concentrations at baseline.

