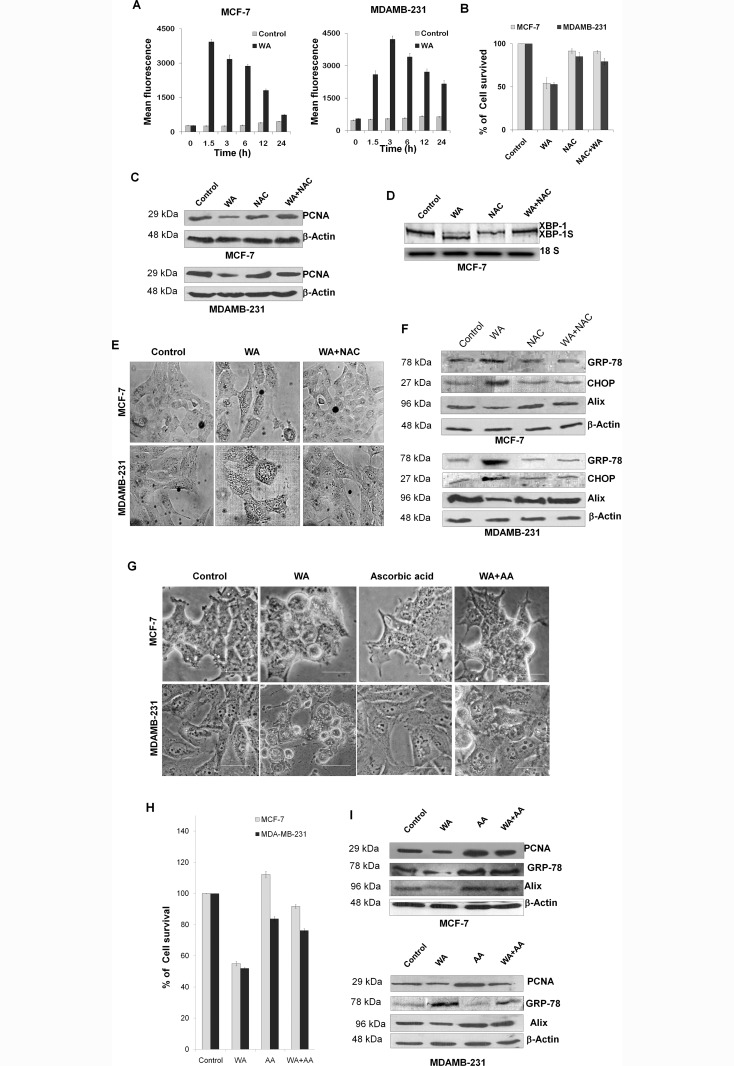
Fig 4. Effect of WA intrinsic ROS generation, ROS mediated ER-stress and paraptosis.
(A) The inter-cellular ROS generation in WA-treated MCF-7 and MDA-MB-231 cells was measured flow cytometrically by the intensity of H2-DCFDA fluorescence. Bar diagram showing mean fluorescence intensity plotted against different time intervals where each point represents as the mean ± SEM of triplicate experiments (P < 0.05 corresponding to control, n = 3). (B) Cell growth inhibition ofMCF-7 and MDA-MB-231cells treated with/without WA (4 μM) for 24h in presence and absence of NAC (ROS scavenger) was assessed by Trypan blue exclusion assay. Percentage of viable cells were plotted against drug concentrations, where the columns are the mean of three independent determinations; bars, standard error (SEM); (P < 0.05 corresponding to control, n = 3). (C) Representative western blot from three separate experiments for PCNA protein using cell lysates of MCF-7 and MDA-MB-231 cells treated with/without WA (4 μM) for 24h in presence and absence of NAC, where β-actin was used as loading control.(D)Total RNA was extracted from MCF-7 cells (treated with/without 4 μM of WA for 24h in presence and absence of NAC) and subjected to RT-PCR where unspliced (XBP1) and spliced (XBP-1s) form of XBP-1 mRNA expression was shown. 18S rRNA was used as loading control.(E) Phase contrast images MCF-7 and MDA-MB-231 cells treated (24h) with DMSO or WA (4 μM) in presence or absence of NAC. Scale bars represent 50 micron and images are representative of at least three independent experiments. (F) Immune reactive bands of proteins GRP-78, CHOP and Alix extracted fromMCF-7 and MDA-MB-231 cells treated with/without 4 μM of WA for 24h in presence and absence of NAC where GAPDH was used as loading controls.(G) Phase contrast images of MCF-7 and MDA-MB-231 cells, treated with either 0 or 4 μM of WA for 24h in presence and absence of ascorbic acid (100 μM). Scale bars represent 50 μm.(H) Cell growth inhibition of MCF-7 and MDA-MB-231cells treated with/without WA (4 μM) for 24h in presence and absence of ascorbic acid (another ROS scavenger) was assessed by Trypan blue exclusion assay. Percentage of viable cells were plotted against drug concentrations, where the columns are the mean of three independent determinations; bars, standard error (SEM). (I) Western blots from three separate experiments for PCNA, Alix and GRP-78 proteins using cell lysates of MCF-7 and MDA-MB-231 cells treated with/without WA (4 μM) for 24h in presence and absence of ascorbic acid, where β-actin was used as loading control.

