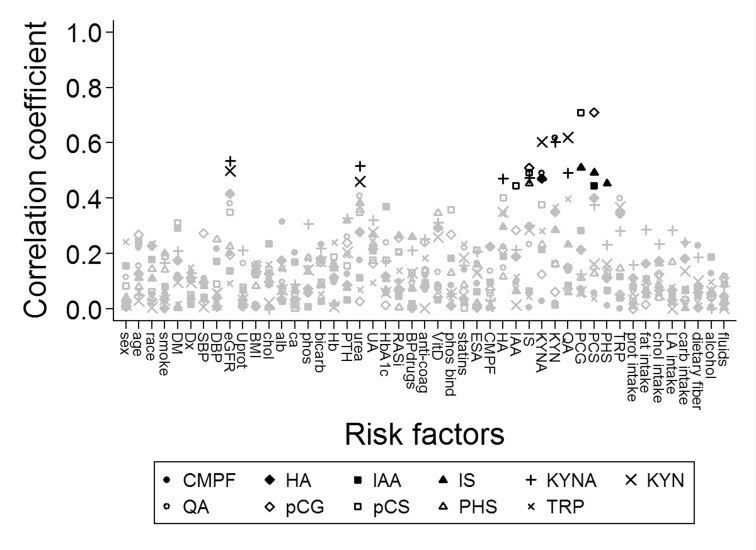
Fig 2. Correlations between uremic solute concentrations and baseline covariates.
The square root of the pearson’s R2 was taken to achieve positive values. The black symbols mark correlations that were statistically significant at a nominal p<0.05 after Bonferroni correction. DM: diabetes mellitus, Dx: congenital kidney disease, SBP: systolic blood pressure, DBP: diastolic blood pressure, eGFR: estimated GFR, Uprot: proteinuria, BMI: body mass index, chol: serum cholesterol, alb: serum albumin, ca: serum calcium, phos: serum phosphate, PTH: serum parathyroid hormone, UA: serum uric acid, RASi: renin-angiotensin inhibition, BPdrugs: blood pressure lowering drugs, anti-coag: anti-coagulation, VitD: vitamin D use, phos binder: phosphate binder use, statin: lipid lowerin drug use, ESA: erythropoiesis stimulating agent use, CMPF: 3-carboxy-4-methyl-5-propyl-2-furanpropionate, HA: hippuric acid, IAA: indole-3-acetic acid, IS: indoxyl sulfate, KYNA: kynurenic acid, KYN: kynurenine, QA: quinolinic acid, PCG: p-cresyl glucuronide, PCS: p-cresyl sulfate, PHS: phenyl sulfate, TRP: tryptophan, prot intake: dietary protein intake, sat fatty acid: saturated fatty acid intake, MU fatty acid: mono unsaturated fatty acid intake, PU fatty acid: poly unsaturated fatty acid intake, carb intake: carbohydrate intake, % fat: proportion of fat in diet, % protein: proportion protein in diet, % carbs: proportion carbohydrates in diet, % unsat fat: proportion of poly unsaturated fatty acids of total fatty acid intake.

