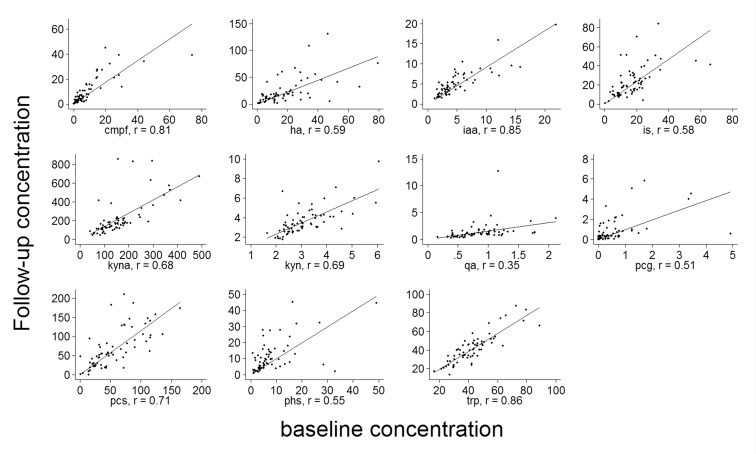
Fig 3. Scatter plots for the concentration in uremic solute concentration at follow-up versus the baseline concentration.
The solid line represents the linear fit. Units are in μmol/l for all solutes except for kynurenic acid which was measured in nmol/l. cmpf: 3-carboxy-4-methyl-5-propyl-2-furanpropionate, ha: hippuric acid, iaa: indole-3-acetic acid, is: indoxyl sulfate, kyna: kynurenic acid, kyn: kynurenine, qa: quinolinic acid, pcg: p-cresyl glucuronide, pcs: p-cresyl sulfate, phs: phenyl sulfate, trp: tryptophan.

