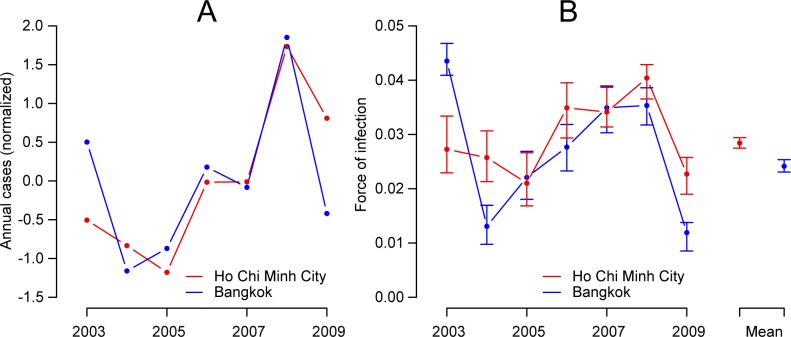
Fig 2. Annual cases distribution and force of infection in two cities, 2003–2009.
A. Normalized annual dengue cases in Ho Chi Minh City and Bangkok, 2003–2009. Normalized numbers were calculated for each year by removing the overall annual mean number of cases and dividing by the standard deviation. B. Annual force of infection in Ho Chi Minh City and in Bangkok, 2003–2009 with 95% bootstrap confidence intervals. On the right is the mean annual force of infection across all years.

