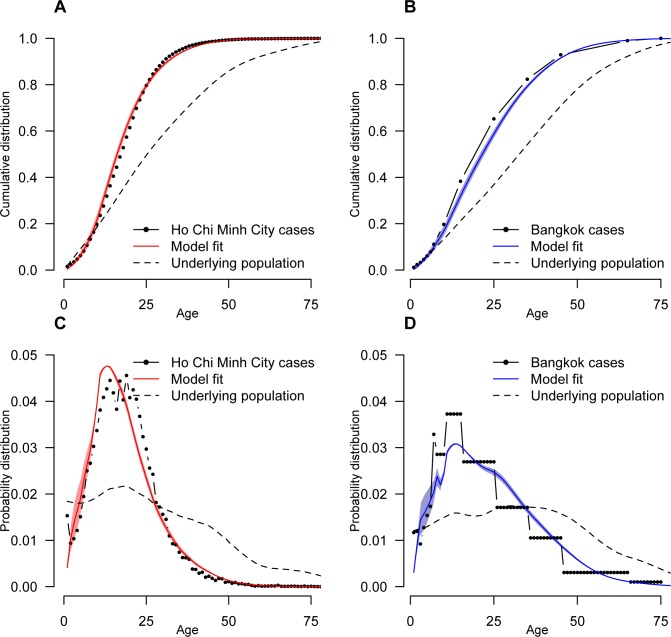
Fig 5. The distribution of ages of cases, adjusting for the age distribution in the country.
A and B represent the cumulative distribution function while C and D represent the probability density functions. The structure of the underlying population is also plotted in each case. In Bangkok, case data is only available in different sized age groups. In panels B and D, we give the same value to all ages within the same age group.

