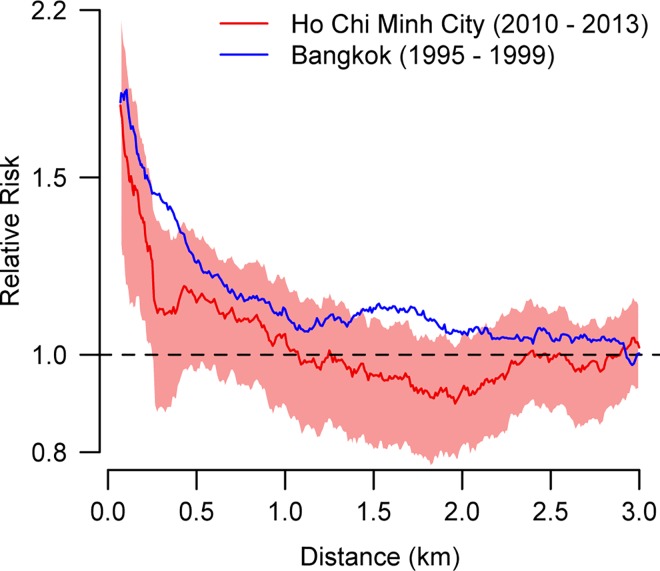
Fig 6. Small-scale spatial dependence for cases occurring in the same month.
The relative risk represents the probability of two cases occurring in the same month and separated by a particular distance range (between d1 and d2) being homotypic relative to the probability of any two cases in that month being homotypic. Values greater than 1.0 suggest clustering of serotypes at that distance. The distance range (d2 –d1) was kept constant at 500m. Relative risks are plotted at the midpoint of the spatial range.

