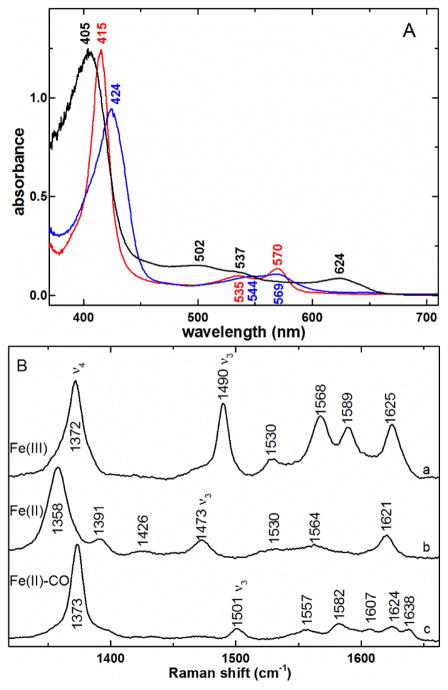
Fig. 2.
A) UV-visible spectra of ferric (black —), ferrous (
 ), and ferrous carbonyl (
 ) complexes of HtaA-CR2. The ferric and ferrous carbonyl samples were in 50 mM Tris-HCl pH 7.0; the ferrous HtaA-CR2 was in 50 mM Tris-HCl pH 7.0. B) High-frequency rR spectra of a) ferric HtaA-CR2, 406.7 nm excitation, b) ferrous HtaA-CR2, 413.1 nm excitation, and c) ferrous-CO HtaA-CR2 complex, 413.1 nm excitation, under the same buffer conditions listed in A. Laser powers incident on the sample for a and b were 5 - 8 mW while c was acquired with 2.5 mW.

